
Page 23 - AIH-2-1
P. 23
Artificial Intelligence in Health COVID-19 diagnosis: FPA, k-NN, and SVM classifiers
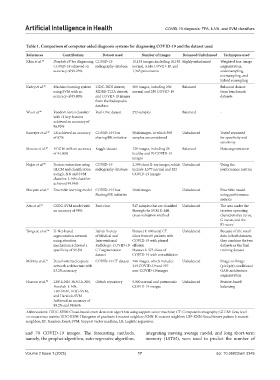
Table 1. Comparison of computer‑aided diagnosis systems for diagnosing COVID‑19 and the dataset used
References Contribution Dataset used Number of images Balanced/Unbalanced Techniques used
Khin et al. 39 Deeplab v3 for diagnosing COVID-19 15,153 images, including 10,192 Highly unbalanced Weighted loss, image
+
COVID-19 achieved an radiography database normal, 3,616 COVID-19, and augmentation,
accuracy of 99.23% 1,345 pneumonia undersampling,
oversampling, and
hybrid resampling
Kadry et al. 45 Machine learning system LIDC-IRDI dataset, 500 images, including 250 Balanced Balanced dataset
using SVM with an RIDER-TCIA dataset, normal and 250 COVID-19 from benchmark
accuracy of 89.80% and COVID-19 images datasets
from the Radiopedia
database
Wu et al. 46 Random forest classifier Real-time dataset 253 samples Balanced -
with 11 key features
achieved an accuracy of
96.95%
Banerjee et al. 47 LR achieved an accuracy COVID-19 Data 5644 images, in which 598 Unbalanced Tested separated
of 87% sharing/BR initiative samples are considered for specificity and
sensitivity
Moutaz et al. 48 VGG16 with an accuracy Kaggle dataset 128 images, including 28 Balanced Data augmentation
of 94.80% healthy and 70 COVID-19
images
Najjar et al. 50 Feature extraction using COVID-19 2,399 chest X-ray images, which Unbalanced Using the
GLCM and classification radiography database include 1,577 normal and 822 performance metrics
using k-NN and SVM COVID-19 images
classifier. k-NN classifier
achieved 99.96%
Maryam et al. 51 Ensemble learning model COVID-19 Data 5644 images Unbalanced Ensemble model
Sharing/BR initiative using performance
metrics
Atta et al. 52 CSDC-SVM model with Real-time 547 samples that are classified Unbalanced The area under the
an accuracy of 98% through the SVM K-fold receiver operating
cross-validation method characteristics curve,
G-mean, and the
F1-score
Tongxue et al. 54 U-Net-based Italian Society Dataset 1: 100 axial CT Unbalanced Because of the small
segmentation network of Medical and slices from 60 patients with data in both datasets,
using attention Interventional COVID-19 with pleural they combine the two
mechanism achieved a Radiology: COVID-19 effusion datasets as the final
specificity of 99.3% CT segmentation Dataset 2: 373 slices of training dataset
dataset COVID-19 with consolidation
Mobiny et al. 55 Detail-oriented capsule COVID-19 CT dataset 746 images, which includes Unbalanced Image-to-Image
network architecture with 349 COVID-19 and 397 (pi×2pix) conditional
83.2% accuracy non-COVID-19 images GAN architecture
augmentation
Hasoon et al. 56 LBP-k-NN, HOG-k-NN, Github repository 5,000 normal and pneumonia Unbalanced Feature-based
Haralick-k-NN, COVID-19 images balancing
LBP-SVM, HOG-SVM,
and Haralick-SVM.
Achieved an accuracy of
89.2% and 98.66%
Abbreviations: CSDC-SVM: Cloud-based smart detection algorithm using support vector machine; CT: Computed tomography; GLCM: Gray level
co-occurrence matrix; HOG-KNN: Histogram of gradients k nearest neighbor; KNN: K-nearest neighbor; LBP-KNN: Local binary pattern k nearest
neighbor; RF: Random forest; SVM: Support vector machine; LR: Logistic regression.
and 70 COVID-19 images. The forecasting methods, integrating moving average model, and long short-term
namely, the prophet algorithm, auto-regressive algorithm, memory (LSTM), were used to predict the number of
Volume 2 Issue 1 (2025) 17 doi: 10.36922/aih.3349