
Page 28 - AIH-2-1
P. 28
Artificial Intelligence in Health COVID-19 diagnosis: FPA, k-NN, and SVM classifiers
Table 4. Overview of the experimental dataset
Patient cases Total no. of patients Total COVID‑19 CT slices considered ROIs Training set ROIs Testing set ROIs
COVID-19 26 342 343 242 101
Normal 15 446 452 394 58
Total 41 788 795 636 159
Abbreviations: CT: Computed tomography; ROI: Region of interest.
For the COVID-19 CT database, a publicly available A B
dataset was utilized to train and test the proposed model.
It contains a total of 349 COVID-19 CT images from
216 patients and 463 non-COVID-19 CTs, which have
been divided into two classes, namely, COVID-19 and
non-COVID-19. The COVID-19 CT dataset was divided
into training and testing datasets, with training datasets
comprising 80% of the total and testing datasets 20%. C D
A pre-processed version of the dataset is available at
https://github.com/UCSD-AI4H/COVID-CT.
4.2. Performance evaluation
The aim of this work is to decrease the false negative and
false positive values, that is, to increase the sensitivity and
specificity, respectively. However, there is often a tradeoff
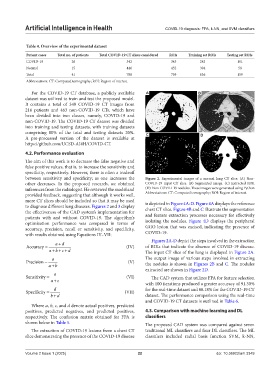
between sensitivity and specificity; as one increases the Figure 2. Experimental images of a normal lung CT slice. (A) Non-
other decreases. In the proposed research, we obtained COVID-19 input CT slice. (B) Segmented image. (C) Extracted ROI.
inferences from the radiologist. He reviewed the model and (D) Non-COVID-19 nodules. These images were generated using Python
provided feedback, suggesting that although it works well, Abbreviations: CT: Computed tomography; ROI: Region of interest.
more CT slices should be included so that it may be used is depicted in Figure 4A‑D. Figure 4A displays the reference
to diagnose different lung diseases. Figures 2 and 3 display chest CT slice. Figure 4B and C illustrate the segmentation
the effectiveness of the CAD system’s implementation for and feature extraction processes necessary for effectively
patients with and without COVID-19. The algorithm’s
optimization performance was compared in terms of isolating the nodules. Figure 4D displays the peripheral
accuracy, precision, recall or sensitivity, and specificity, GGO lesion that was excised, indicating the presence of
with results obtained using Equations IV–VII: COVID-19.
Figures 2A‑D depict the steps involved in the extraction
ad
Accuracy (IV) of ROIs that indicate the absence of COVID-19 disease.
cd
ab The input CT slice of the lung is displayed in Figure 2A.
a The output image of various steps involved in extracting
Precision (V) the nodules is shown in Figures 2B and C. The nodules
ab
extracted are shown in Figure 2D.
a
Sensitivity (VI) The CAD system that utilizes FPA for feature selection
ac
with 100 iterations produced a greater accuracy of 91.30%
d for the real-time dataset and 88.18% for the COVID-19 CT
Specificity (VII)
bd dataset. The performance comparison using the real-time
and COVID-19 CT datasets is outlined in Table 6.
Where a, b, c, and d denote actual positives, predicted
positives, predicted negatives, and predicted positives, 4.3. Comparison with machine learning and DL
respectively. The confusion matrix obtained for FPA is classifiers
shown below in Table 5. The proposed CAD system was compared against seven
The extraction of COVID-19 lesions from a chest CT traditional ML classifiers and four DL classifiers. The ML
slice demonstrating the presence of the COVID-19 disease classifiers included radial basis function SVM, k-NN,
Volume 2 Issue 1 (2025) 22 doi: 10.36922/aih.3349