
Page 30 - AIH-2-1
P. 30
Artificial Intelligence in Health COVID-19 diagnosis: FPA, k-NN, and SVM classifiers
Table 7. Machine learning classifier comparison
Classifier/ RBF‑SVM k‑NN LDA RF NB EB AB Our proposed
performance system using
metrics real‑time dataset
Accuracy (M±SD) 0.6329±0.0387 0.8572±0.0243 0.8706±0.0210 0.8996±0.0180 0.7541±0.0403 0.9044±0.0232 0.8753±0.0220 0.9130±0.0177
Precision (M±SD) 0.9189±0.0660 0.8779±0.0481 0.8861±0.0341 0.9135±0.0337 0.9093±0.0551 0.9113±0.0388 0.8697±0.0404 0.8989±0.0324
Recall (M±SD) 0.1815±0.0515 0.7855±0.0495 0.8095±0.0435 0.8524±0.0432 0.4883±0.0722 0.8673±0.0403 0.8434±0.0381 0.8003±0.0340
Specificity (M±SD) 0.9867±0.0111 0.9149±0.0320 0.8095±0.0435 0.9373±0.0235 0.9625±0.0230 0.9342±0.0281 0.9009±0.0321 0.9302±0.0217
Abbreviations: AB: AdaBoost; EB: Extreme boosting; k-NN: k-nearest neighbor; LDA: Linear discriminant analysis; NB: Naïve bias; RBF-SVM: Radial
basis function-support vector machine; RF: Random forest.
Table 8. Deep learning classifier comparison Our proposed system achieved higher precision, recall,
and F1 score values, as shown in Table 9.
Classifiers/ CNN RNN LSTM BLSTM
performance metrics (%) (%) (%) (%) 4.5. Statistical test
Training accuracy 89.15 84.74 80.66 83.64 The Mann–Whitney U test revealed significant differences
Testing accuracy 89.31 85.53 83.01 83.67 between the variables and the dependent variable
Training precision 88.54 81.29 80.57 81.27 (P < 0.001). The difference is statistically significant
Testing precision 84.81 84.50 83.58 81.94 (P < 0.001). The P = 0.001, which is less than the minimum
Training recall 85.61 83.39 71.95 80.07 value of 0.05 for significance. Kendal’s rank correlation
Testing recall 93.05 82.33 77.77 81.94 coefficient map examines sample correlation. Kendal’s
Training specificity 87.05 82.33 76.02 80.67 correlation map for the selected attributes in the dataset is
Testing specificity 88.74 83.91 80.57 81.94 given in Figure 3.
Abbreviations: CNN: Convolutional neural network; 5. Conclusion
BLSTM: Bidirectional LSTM; LSTM: Long short-term memory;
RNN: Recurrent neural network. Our proposed COVID-19 CAD system achieved an
accuracy of 91.30% on a real-time dataset and 88.18%
accuracy on the COVID-19 CT Public Dataset. Notably,
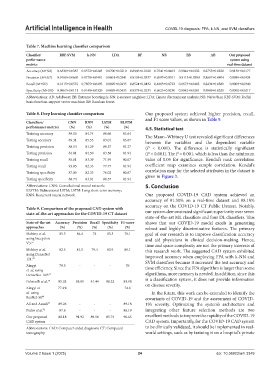
Table 9. Comparison of the proposed CAD system with
state‑of‑the‑art approaches for the COVID‑19 CT dataset our system demonstrated significant superiority over seven
state-of-the-art ML classifiers and four DL classifiers. This
State‑of‑the‑art Accuracy Precision Recall Specificity F1‑score shows that our COVID-19 model excels in generating
approaches (%) (%) (%) (%) (%) robust and highly discriminative features. The primary
Mobiny et al. 85.3 84.4 74 85.3 78.1 goal of our research is to improve classification accuracy
using Inception and aid physicians in clinical decision-making. Hence,
V3. 55 time and space complexity are not the primary interests of
Mobiny et al. 82.5 81.5 79.4 83.9 80.1 this research work. The suggested CAD system exhibited
using DenseNet improved accuracy when employing FPA with k-NN and
121. 55 SVM classifiers because it increased the test accuracy and
Xingyi 79.5 - - - 76 time efficiency. Since the FPA algorithm is larger than some
et al. using
DenseNet-169. 69 algorithms, more memory is needed. In addition, since this
Polsinelli et al. 70 85.03 85.01 81.44 88.23 83.98 is a classification system, it does not provide information
Xingyi et 77.4% - - - 74.6 on disease severity.
al. using In the future, this work can be extended to identify the
ResNet-50 69 covariants of COVID-19 and the assessment of COVID-
Ali and Assadi 71 89.26 - - - 89.18 19’s severity. Optimizing the system’s architecture and
Pedro et al. 72 87.6 - - - 86.19 integrating other feature selection methods are two
Our proposed 88.18 91.92 89.56 85.74 90.65 excellent methods to improve the rapidity of the COVID-19
CAD system CAD system. Importantly, for the COVID-19 CAD system
Abbreviations: CAD: Computer-aided diagnosis; CT: Computed to be clinically validated, it should be implemented in real-
tomography. world settings, such as by training it on a hospital’s private
Volume 2 Issue 1 (2025) 24 doi: 10.36922/aih.3349