
Page 29 - AIH-2-1
P. 29
Artificial Intelligence in Health COVID-19 diagnosis: FPA, k-NN, and SVM classifiers
Figure 3. Kendal’s rank correlation map. Output generated using the Python application
A B Table 5. Generated confusion matrix
Actual/predicted Predicted positive Predicted negative
Actual positive 94 9
Actual negative 5 51
Table 6. Performance comparison using real‑time and
C D COVID‑19 dataset
Performance Real‑time COVID‑19 CT
metrics average dataset dataset
Accuracy (M±SD) 0.9130±0.0177 0.8818±0.0180
Precision (M±SD) 0.8989±0.0324 0.9192±0.0280
Recall (M±SD) 0.8003±0.0340 0.8956±0.0305
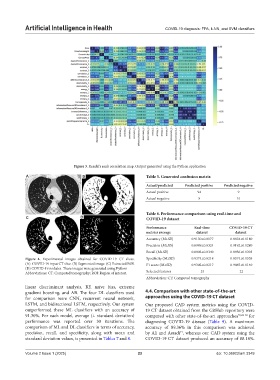
Figure 4. Experimental images obtained for COVID-19 CT slices. Specificity (M±SD) 0.9374±0.0218 0.8574±0.0538
(A) COVID-19 input CT slice. (B) Segmented image. (C) Extracted ROI. F1 score (M±SD) 0.9302±0.0217 0.9065±0.0140
(D) COVID-19 nodules. These images were generated using Python
Abbreviations: CT: Computed tomography; ROI: Region of interest. Selected features 24 22
Abbreviation: CT: Computed tomography
linear discriminant analysis, RF, naïve bias, extreme
gradient boosting, and AB. The four DL classifiers used 4.4. Comparison with other state-of-the-art
for comparison were CNN, recurrent neural network, approaches using the COVID-19 CT dataset
LSTM, and bidirectional LSTM, respectively. Our system Our proposed CAD system metrics using the COVID-
outperformed these ML classifiers with an accuracy of 19 CT dataset obtained from the GitHub repository were
91.30%. For each model, average (± standard deviation) compared with other state-of-the-art approaches 55,69-72 for
performance was reported over 30 iterations. The diagnosing COVID-19 disease (Table 9). A maximum
comparison of ML and DL classifiers in terms of accuracy, accuracy of 89.36% in this comparison was achieved
precision, recall, and specificity, along with mean and by Ali and Assadi , whereas our CAD system using the
71
standard deviation values, is presented in Tables 7 and 8. COVID-19 CT dataset produced an accuracy of 88.18%.
Volume 2 Issue 1 (2025) 23 doi: 10.36922/aih.3349