
Page 25 - AIH-2-1
P. 25
Artificial Intelligence in Health COVID-19 diagnosis: FPA, k-NN, and SVM classifiers
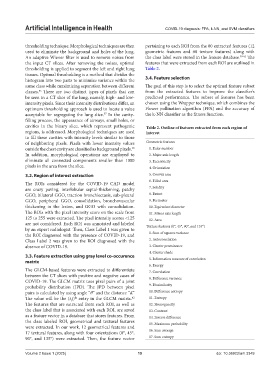
thresholding technique. Morphological techniques are then pertaining to each ROI from the 80 extracted features (12
used to eliminate the background and holes of the lung. geometric features and 68 texture features) along with
An adaptive Wiener filter is used to remove noises from the class label were stored in the feature database. 59-61 The
the input CT slices. After removing the noises, optimal features that were extracted from each ROI are outlined in
thresholding is applied to segment the left and right lung Table 2.
tissues. Optimal thresholding is a method that divides the
histogram into two parts to minimize variance within the 3.4. Feature selection
same class while maximizing separation between different The goal of this step is to select the optimal feature subset
classes. There are two distinct types of pixels that can from the extracted features to improve the classifier’s
53
be seen in a CT slice of the lung, namely, high- and low- predicted performance. The subset of features has been
intensity pixels. Since their intensity distributions differ, an chosen using the Wrapper technique, which combines the
optimum thresholding approach is used to locate a value Flower pollination algorithm (FPA) and the accuracy of
acceptable for segregating the lung slice. In the cavity- the k-NN classifier as the fitness function.
57
filling process, the appearance of airways, small holes, or
cavities in the binary slice, which represent pathogenic Table 2. Outline of features extracted from each region of
regions, is addressed. Morphological techniques are used interest
to fill these cavities with intensity levels similar to those
of neighboring pixels. Pixels with lower intensity values Geometric features
outside the chest cavity are classified as background pixels. 1. Euler number
58
In addition, morphological operations are employed to 2. Major axis length
eliminate all connected components smaller than 1000 3. Eccentricity
pixels in the area from the slice. 4. Orientation
3.2. Region of interest extraction 5. Convex area
6. Filled area
The ROIs considered for the COVID-19 CAD model
are crazy paving, interlobular septal-thickening, patchy 7. Solidity
GGO, bilateral GGO, traction bronchiectasis, sub-pleural 8. Extent
GGO, peripheral GGO, consolidation, bronchovascular 9. Perimeter
thickening in the lesion, and GGO with consolidation. 10. Equivalent diameter
The ROIs with the pixel intensity score on the scale from 11. Minor axis length
125 to 255 were extracted. The pixel intensity scores <125 12. Area
are not considered. Each ROI was annotated and labeled Texture features (0°, 45°, 90°, and 135°)
by an expert radiologist. Then, Class Label 1 was given to
the ROI diagnosed with the presence of COVID-19, and 1. Sum of squares variance
Class Label 2 was given to the ROI diagnosed with the 2. Autocorrelation
absence of COVID-19. 3. Cluster prominence
4. Cluster shade
3.3. Feature extraction using gray level co-occurence 5. Information measure of correlation
matrix
6. Energy
The GLCM-based features were extracted to differentiate 7. Correlation
between the CT slices with positive and negative cases of 8. Difference variance
COVID-19. The GLCM matrix uses pixel pairs of a joint
probability distribution (JPD). The JPD between pixel 9. Dissimilarity
pairs is calculated by using angle “θ” and the distance “d.” 10. Difference entropy
The value will be the (i,j) entry in the GLCM matrix. 11. Entropy
th
42
The features that are extracted from each ROI, as well as 12. Homogeneity
the class label that is associated with each ROI, are saved 13. Contrast
as a feature vector in a database that stores features. From 14. Inverse difference
the class labeled ROI, geometrical and textural features 15. Maximum probability
were extracted. In our work, 12 geometrical features and
17 textural features, along with four orientations (0°, 45°, 16. Sum average
90°, and 135°) were extracted. Then, the feature vector 17. Sum entropy
Volume 2 Issue 1 (2025) 19 doi: 10.36922/aih.3349