
Page 104 - AIH-2-3
P. 104
Artificial Intelligence in Health Bone suppression utility for chest diagnosis
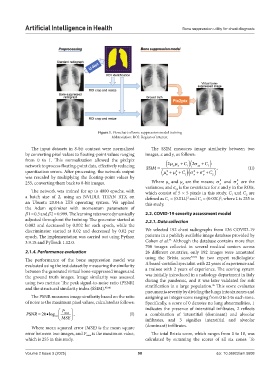
Figure 1. Flowchart of bone suppression model training
Abbreviation: ROI: Region of interest.
The input datasets in 8-bit contrast were normalized The SSIM measures image similarity between two
by converting pixel values to floating-point values ranging images, x and y, as follows:
from 0 to 1. This normalization allowed the pix2pix C
network to process floating-point data, effectively reducing SSIM 2 y C 2 xy 2 , (II)
x
1
quantization errors. After processing, the network output x 2 2 y C 2 x 2 y C
1
2
was rescaled by multiplying the floating-point values by
2
2
255, converting them back to 8-bit images. Where µ and µ are the means; σ and σ are the
y
x
y
x
variances; and σ is the covariance for x and y in the ROIs,
xy
The network was trained for up to 4000 epochs, with which consist of 5 × 5 pixels in this study. C and C are
1
2
a batch size of 2, using an NVIDIA TITAN RTX on defined as C = (0.01L) and C = (0.03L) , where L is 255 in
2
2
an Ubuntu 20.04.6 LTS operating system. We applied this study. 1 2
the Adam optimizer with momentum parameters of
1 = 0.5 and 2 = 0.999. The learning rates were dynamically 2.2. COVID-19 severity assessment model
adjusted throughout the training: The generator started at 2.2.1. Data collection
0.002 and decreased by 0.002 for each epoch, while the
discriminator started at 0.02 and decreased by 0.02 per We selected 192 chest radiographs from 136 COVID-19
epoch. The implementation was carried out using Python patients in a publicly available image database provided by
33
3.9.18 and PyTorch 1.12.0. Cohen et al. Although the database contains more than
700 images collected in several medical centers across
2.1.4. Performance evaluation 26 different countries, only 192 images were annotated
The performance of the bone suppression model was using the Brixia score 33,34 by two expert radiologists:
evaluated using the test dataset by measuring the similarity A board-certified specialist with 22 years of experience and
between the generated virtual bone-suppressed images and a trainee with 2 years of experience. The scoring system
the ground truth images. Image similarity was assessed was initially introduced in a radiology department in Italy
using two metrics: The peak signal-to-noise ratio (PSNR) during the pandemic, and it was later validated for risk
36
and the structural similarity index (SSIM). 45,46 stratification in a large population. This score evaluates
pneumonia severity by dividing the lungs into six zones and
The PSNR measures image similarity based on the ratio assigning an integer score ranging from 0 to 3 to each zone.
of noise to the maximum pixel values, calculated as follows: Specifically, a score of 0 denotes no lung abnormalities, 1
P indicates the presence of interstitial infiltrates, 2 reflects
PSNR 20log 10 max , (I) a combination of interstitial (dominant) and alveolar
MSE infiltrates, and 3 signifies interstitial and alveolar
Where mean squared error (MSE) is the mean square (dominant) infiltrates.
error between two images, and P max is the maximum value, The total Brixia score, which ranges from 0 to 18, was
which is 255 in this study. calculated by summing the scores of all six zones. To
Volume 2 Issue 3 (2025) 98 doi: 10.36922/aih.5608