
Page 106 - AIH-2-3
P. 106
Artificial Intelligence in Health Bone suppression utility for chest diagnosis
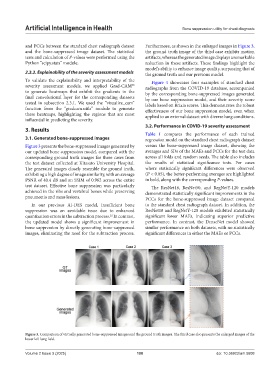
and PCCs between the standard chest radiograph dataset Furthermore, as shown in the enlarged images in Figure 3,
and the bone-suppressed image dataset. The statistical the ground truth image of the third case exhibits motion
tests and calculation of P-values were performed using the artifacts, whereas the generated image displays a remarkable
Python “scipy.stats” module. reduction in these artifacts. These findings highlight the
model’s ability to enhance image quality, surpassing that of
2.3.2. Explainability of the severity assessment models the ground truth and our previous model.
To validate the explainability and interpretability of the Figure 4 showcases four examples of standard chest
severity assessment models, we applied Grad-CAM radiographs from the COVID-19 database, accompanied
38
to generate heatmaps that exhibit the gradients in the by the corresponding bone-suppressed images generated
final convolutional layer for the corresponding datasets by our bone suppression model, and their severity score
tested in subsection 2.3.1. We used the “visualize_cam” labels based on Brixia scores. This demonstrates the robust
function from the “gradcam.utils” module to generate effectiveness of our bone suppression model, even when
these heatmaps, highlighting the regions that are most applied to an external dataset with diverse lung conditions.
influential in predicting the severity.
3.2. Performance in COVID-19 severity assessment
3. Results
Table 1 compares the performance of each trained
3.1. Generated bone-suppressed images regression model on the standard chest radiograph dataset
Figure 3 presents the bone-suppressed images generated by versus the bone-suppressed image dataset, showing the
our updated bone suppression model, compared with the averages and SDs of the MAEs and PCCs for the test data
corresponding ground truth images for three cases from across all folds and random seeds. The table also includes
the test dataset collected at Kitasato University Hospital. the results of statistical significance tests. For cases
The generated images closely resemble the ground truth, where statistically significant differences were observed
exhibiting a high degree of image similarity, with an average (P < 0.05), the better-performing averages are highlighted
PSNR of 40.4 dB and an SSIM of 0.962 across the entire in bold, along with the corresponding P-values.
test dataset. Effective bone suppression was particularly The ResNet18, ResNet50, and RegNetY-120 models
achieved in the ribs and vertebral bones while preserving demonstrated statistically significant improvements in the
pneumonia and mass lesions. PCCs for the bone-suppressed image dataset compared
In our previous AI-DES model, insufficient bone to the standard chest radiograph dataset. In addition, the
suppression was an avoidable issue due to enhanced ResNet18 and RegNetY-120 models exhibited statistically
quantization errors in the subtraction process. In contrast, significant lower MAEs, indicating superior predictive
22
the updated model shows a significant improvement in performance. In contrast, the DenseNet model showed
bone suppression by directly generating bone-suppressed similar performance on both datasets, with no statistically
images, eliminating the need for the subtraction process. significant differences in either the MAEs or PCCs.
Figure 3. Comparison of virtually generated bone-suppressed images and the ground truth images. The third case also presents the enlarged images of the
lower left lung field.
Volume 2 Issue 3 (2025) 100 doi: 10.36922/aih.5608