
Page 107 - AIH-2-3
P. 107
Artificial Intelligence in Health Bone suppression utility for chest diagnosis
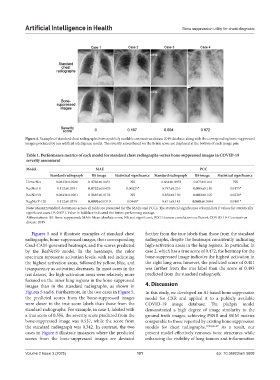
Figure 4. Examples of standard chest radiographs from a publicly available coronavirus disease 2019 database, along with the corresponding bone-suppressed
images produced by our artificial intelligence model. The severity scores based on the Brixia score are displayed at the bottom of each image pair.
Table 1. Performance metrics of each model for standard chest radiographs versus bone‑suppressed images in COVID‑19
severity assessment
Model MAE PCC
Standard radiograph BS image Statistical significance Standard radiograph BS image Statistical significance
DenseNet 0.0823±0.0286 0.0768±0.0451 NS 0.864±0.0953 0.873±0.164 NS
ResNet18 0.112±0.0551 0.0722±0.0435 0.00225* 0.797±0.216 0.895±0.150 0.0175*
ResNet50 0.0843±0.0261 0.0685±0.0178 NS 0.858±0.130 0.882±0.105 0.0230*
RegNetY-120 0.112±0.0379 0.0993±0.0319 0.0448* 0.811±0.143 0.868±0.0984 0.0181*
Note: Means±standard deviations across all folds are presented for the MAEs and PCCs. The statistical significance column lists P values for statistically
significant cases (P<0.05*). Value in boldface indicated the better-performing average.
Abbreviations: BS: Bone-suppressed; MAE: Mean absolute error; NS: not significant; PCC: Pearson correlation coefficient, COVID-19: Coronavirus
disease 2019.
Figures 5 and 6 illustrate examples of standard chest further from the true labels than those from the standard
radiographs, bone-suppressed images, their corresponding radiographs, despite the heatmaps consistently indicating
Grad-CAM-generated heatmaps, and the scores predicted high-activation areas in the lung regions. In particular, in
by the ResNet50 model. In the heatmaps, the color case 2, which has a true score of 0.472, the heatmap for the
spectrum represents activation levels, with red indicating bone-suppressed image indicates the highest activation in
the highest activation areas, followed by yellow, blue, and the right lung area; however, the predicted score of 0.401
transparency as activation decreases. In most cases in the was further from the true label than the score of 0.493
test dataset, the high-activation areas were relatively more predicted from the standard radiograph.
focused on the inner lung regions in the bone-suppressed
images than in the standard radiographs, as shown in 4. Discussion
Figures 5 and 6. Furthermore, in the two cases in Figure 5, In this study, we developed an AI-based bone suppression
the predicted scores from the bone-suppressed images model for CXR and applied it to a publicly available
were closer to the true score labels than those from the COVID-19 image database. The pix2pix model
standard radiographs. For example, in case 1, labeled with demonstrated a high degree of image similarity to the
a true score of 0.556, the severity score predicted from the ground truth images, achieving PSNR and SSIM metrics
bone-suppressed image was 0.537, while the score from comparable to those reported by existing bone suppression
the standard radiograph was 0.342. In contrast, the two models for chest radiographs. 17,23,26-27 As a result, our
cases in Figure 6 illustrate instances where the predicted present model effectively removes bone structures while
scores from the bone-suppressed images are deviated enhancing the visibility of lung tumors and inflammation
Volume 2 Issue 3 (2025) 101 doi: 10.36922/aih.5608