
Page 120 - AIH-2-3
P. 120
Artificial Intelligence in Health Opportunities for AI-based arrhythmia screening
quantitative identification of the QRS complex’s location, segment of the signal, representing a specific rhythm
amplitude, and scaling. In addition, wavelet analysis condition (template) or wavelet, is used to isolate unique
29
can reveal features that may not be apparent when using depolarization events within the ECG data stream.
Daubechies and Coiflet wavelets. 34-37 Biological signals, such as the ECG, are often
One clinically significant application of wavelet analysis is stochastic and complex. These signals may vary rapidly
the separation of a maternal ECG from the fetal ECG during due to biological and electrochemical influences. The
pregnancy. While the waveforms and wavelet structures of matched filter approach can be applied to signals that
the two ECGs may share similarities, a major difference is lack symmetry at the zero-amplitude axis, exhibit varying
that the fetal ECG typically has a higher repetition rate and repetition frequencies, or have inconsistent repeatable
a smaller amplitude compared to the maternal ECG. The amplitudes over time. 37-39 The erratic signal is presumably
distinct differences in the wavelet signals of fetal ECG and due to chemical, mental, or physical influences, but it is
maternal ECG arise because the two ECG signals exist at not necessarily a threat or deviation from life-sustaining
different time and frequency scales. data streams. The matched filter approach can be used to
quantify the similarity between the acquired continuous
3.5. Matched filter analysis signal and a configured template, expressed by a cross-
To extract maximum detail from an ECG, the optimal correlation coefficient that defines the match. In this way,
approach is to perform an AI-based mathematical analysis any deviations from the template can be identified and
of the four-dimensional vector array derived from 12-lead isolated for diagnostic evaluation.
data acquisition, represented in spherical coordinates: It has been shown that a small number of
linear measurements of the ECG contain adequate
v v(, ,, t) (I) information to reconstruct a sparse or compressible
signal (i.e., compressive sensing/data acquisition). 39-41
This vector array is deconvolved for processing using In practice, this sparse signal will be redefined in
advanced tools (Figure 5), such as the matched filter multidimensional space. Compressive sensing is a
approach, which introduces a sparse multidimensional technique for efficiently acquiring data and reconstructing
vector w . In this approach, a well-defined temporal signals within limits by facilitating data reduction below
A B D
C E
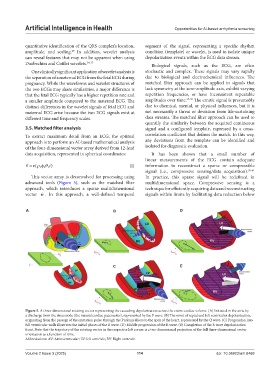
Figure 5. A three-dimensional rotating vector representing the cascading depolarization across the entire cardiac volume. (A) Initiated in the atria by
a discharge from the sinus node (the natural cardiac pacemaker), represented by the P wave. (B) The onset of septal and left ventricular depolarization,
originating from the passage of the excitation pulse through the Purkinje fibers to the apex of the heart, represented by the Q wave. (C) Progression into
full ventricular walls illustrates the initial phases of the R wave. (D) Middle progression of the R wave. (E) Completion of the R wave depolarization
front. Note that the trajectory of the rotating vector in the respective left corner is a two-dimensional projection of the full three-dimensional vector
orientation as a function of time.
Abbreviations: AV: Atrioventricular; LV: left ventricle; RV: Right ventricle.
Volume 2 Issue 3 (2025) 114 doi: 10.36922/aih.8468