
Page 89 - AIH-2-3
P. 89
Artificial Intelligence in Health Organizational culture’s impact on burnout
3. Data and methods 30% test data. The models created 500 trees. In Model 1,
where question C30 served as the DV and was measured
3.1. Setting, measurement, and study design with questions B1, B5, B6, B7, B8, B9, B10, B11, B12, B15,
This cross-sectional and exploratory study was approved and B17, the model explained 6% of the variance. At each
by the Harrisburg University of Science and Technology split, three variables were tested based on the lowest mean
Institutional Review Board (20221026). To construct squared error (MSE). Model 1 reached approximately 1%
a random forest model, the optimal sample size was error after 500 trees, as shown in Table 1. The lowest MSE
determined to be 570, as the model requires ten times the was achieved with 27 trees. The lack of improvement in
number of features (57) in the dataset. performance after 27 trees indicates diminishing returns,
suggesting that a higher number of trees is not optimal
A 57-item Likert scale survey, validated and reliable
for measuring OC and burnout, developed by Kovner for Model 1 and does not provide additional information.
In addition, the out-of-bag (OOB) score of 1.25 indicates
et al. 33,34 was used for data collection. Detailed information that approximately one out of the data left out of training
regarding the instrument’s validated and reliability can be was correctly predicted. A lower OOB score reflects better
found in Kovner et al.’s 33,34 studies and in a previous study performance, which aligns with the low MSE results.
based on the same dataset. The scale was modified to
32
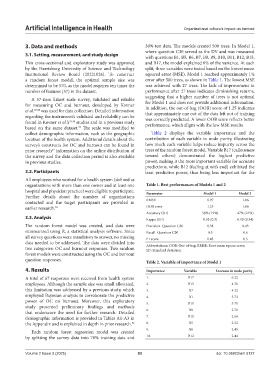
collect demographic information, such as the geographic Table 2 displays the variable importance and the
location of the health system. Additional details about the contribution of each variable to node purity, illustrating
survey’s constructs for OC and burnout can be found in how much each variable helps reduce impurity across the
32
prior research Information on the online distribution of trees of the random forest model. Variable B17 (callousness
the survey and the data collection period is also available toward others) demonstrated the highest predictive
in previous studies. power, making it the most important variable for accurate
predictions, while B12 (feeling at wit’s end) exhibited the
3.2. Participants least predictive power, thus being less important for the
All employees who worked for a health system (defined as
organizations with more than one owner and at least one Table 1. Best performances of Models 1 and 2
hospital and physician practice) were eligible to participate. Parameter Model 1 Model 2
Further details about the number of organizations
contacted and the target participants are provided in RMSE 0.97 1.06
earlier research. 32 OOB error 1.25 1.06
Accuracy (SD) 58% (19%) 47% (21%)
3.3. Analysis Kappa (SD) 0.33 (0.3) 0.19 (0.34)
The random forest model was created, and data were Precision–Question C30 0.38 0.43
summarized using R, a statistical analysis software. Since Recall–Question C30 0.5 0.6
all survey questions were mandatory to answer, no missing F1 score 0.43 0.5
data needed to be addressed. The data were divided into
two categories: OC and burnout responses. Two random Abbreviations: OOB: Out-of-bag; RMSE: Root mean square error;
SD: Standard deviation.
forest models were constructed using the OC and burnout
question responses.
Table 2. Variable of importance of Model 1
4. Results Importance Variable Increase in node purity
A total of 67 responses were received from health system 1. B17 6.22
employees. Although the sample size was small alleviated, 2. B15 4.76
this limitation was addressed by a previous study, which 3. B7 4.32
employed Bayesian analysis to corroborate the predictive 4. B1 3.73
power of OC on burnout. Moreover, this exploratory 5. B11 3.71
study presented preliminary findings and methods
that underscore the need for further research. Detailed 6. B9 2.70
demographic information is provided in Tables A1-A3 in 7. B10 2.68
the Appendix and is explained in depth in prior research. 32 8. B5 2.52
Each random forest regression model was created 9. B8 2.45
by splitting the survey data into 70% training data and 10. B12 2.44
Volume 2 Issue 3 (2025) 83 doi: 10.36922/aih.5127