
Page 91 - AIH-2-3
P. 91
Artificial Intelligence in Health Organizational culture’s impact on burnout
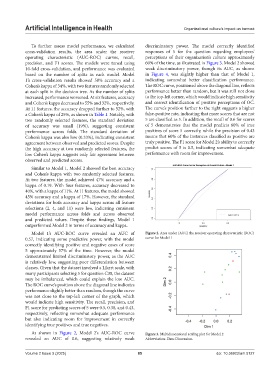
To further assess model performance, we calculated discriminatory power. The model correctly identified
cross-validation results, the area under the receiver responses of 5 for the question regarding employees’
operating characteristic (AUC-ROC) curves, recall, perceptions of their organization’s culture approximately
precision, and F1 scores. The models were tuned using 60% of the time, as illustrated in Figure 3. Model 2 showed
10-fold cross-validation, and performance was evaluated weak discriminatory power, though its AUC, as shown
based on the number of splits in each model. Model in Figure 4, was slightly higher than that of Model 1,
1’s cross-validation results showed 58% accuracy and a indicating somewhat better classification performance.
Cohen’s kappa of 34%, with two features randomly selected The ROC curve, positioned above the diagonal line, reflects
at each split in the decision tree. As the number of splits performance better than random, but it was still not close
increased, performance worsened. At six features, accuracy to the top-left corner, which would indicate high sensitivity
and Cohen’s kappa decreased to 55% and 32%, respectively. and correct identification of positive perceptions of OC.
At 11 features, the accuracy dropped further to 52%, with The curve’s position farther to the right suggests a higher
a Cohen’s kappa of 25%, as shown in Table 1. Notably, with false-positive rate, indicating that more scores that are not
two randomly selected features, the standard deviation 5 are classified as 5. In addition, the recall of 0.6 for scores
of accuracy was small (19%), suggesting consistent of 5 demonstrates that the model predicts 60% of true
performance across folds. The standard deviation of positives of score 5 correctly, while the precision of 0.43
Cohen’s kappa was also low (0.33%), indicating consistent means that 60% of the instances classified as positive are
agreement between observed and predicted scores. Despite truly positive. The F1 score for Model 2’s ability to correctly
the high accuracy at two randomly selected features, the predict scores of 5 is 0.5, indicating somewhat adequate
low Cohen’s kappa suggests only fair agreement between performance with room for improvement.
observed and predicted scores.
Similar to Model 1, Model 2 showed the best accuracy
and Cohen’s kappa with two randomly selected features.
At two features, the model achieved 47% accuracy and a
kappa of 0.19. With four features, accuracy decreased to
40%, with a kappa of 11%. At 11 features, the model showed
45% accuracy and a kappa of 17%. However, the standard
deviations for both accuracy and kappa across all feature
selections (2, 4, and 11) were low, indicating consistent
model performance across folds and across observed
and predicted values. Despite these findings, Model 1
outperformed Model 2 in terms of accuracy and kappa.
Model 1’s AUC-ROC curve revealed an AUC of Figure 2. Area under (AUC) the receiver operating characteristic (ROC)
0.57, indicating some predictive power, with the model curve for Model 1
correctly identifying positive and negative cases of score
5 approximately 57% of the time. However, the model
demonstrated limited discriminatory power, as the AUC
is relatively low, suggesting poor differentiation between
classes. Given that the dataset involved a Likert scale, with
many participants selecting 5 for question C30, the dataset
may be imbalanced, which could explain the low AUC.
The ROC curve’s position above the diagonal line indicates
performance slightly better than random, though the curve
was not close to the top-left corner of the graph, which
would indicate high sensitivity. The recall, precision, and
F1 score for predicting scores of 5 were 0.5, 0.38, and 0.43,
respectively, reflecting somewhat adequate performance
but also indicating room for improvement in correctly
identifying true positives and true negatives.
As shown in Figure 2, Model 2’s AUC-ROC curve Figure 3. Multidimensional scaling plot for Model 2
revealed an AUC of 0.6, suggesting relatively weak Abbreviation: Dim: Dimension.
Volume 2 Issue 3 (2025) 85 doi: 10.36922/aih.5127