
Page 90 - AIH-2-3
P. 90
Artificial Intelligence in Health Organizational culture’s impact on burnout
accuracy of predictions. Due to its high node purity score, as the splitting criterion. This model explained 17% of the
B17 effectively split Model 1, reducing error in C30 scores. variance. Model 2 exhibited an error of approximately 1%
In contrast, B12, which showed a lower node purity score, after reaching 500 trees, as shown in Table 1. However, the
contributed less to reducing error in the model. B12 had lowest MSE was achieved with 23 trees. The OOB score of
fewer splits and a smaller reduction in impurity compared 1.25 indicates that approximately 1 out of the 30%of the
to B17. The high node purity score for B17 was attributed test data, which was left out, was correctly predicted. The
to a moderate negative correlation of -0.33 with C30. low OOB score aligns with the low MSE.
Conversely, the low node purity score for B12 reflected a Similar to Model 1, a higher number of trees resulted
weak negative correlation of -0.19 with C30, suggesting in diminished performance due to the lack of additional
that B12 does not significantly explain variability in C30. information provided beyond 23 trees. The variable of
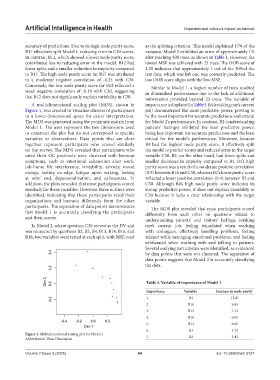
A multidimensional scaling plot (MDS), shown in importance is displayed in Table 3. B4 (retaking one’s current
Figure 1, was created to visualize clusters of participants job) demonstrated the most predictive power, proving to
in a lower-dimensional space for easier interpretation. be the most important for accurate predictions and critical
The MDS was generated using the proximity matrix from for Model 2’s performance. In contrast, B2 (understanding
Model 1. The axes represent the two dimensions used patients’ feelings) exhibited the least predictive power,
to construct the plot but do not correspond to specific being less important for accurate predictions and the least
variables or observations. Data points that are close critical for the model’s performance. Moreover, because
together represent participants who scored similarly B4 had the highest node purity score, it effectively split
on the survey. The MDS revealed that participants who the model to predict scores and reduced error in the target
rated their OC positively were clustered with burnout variable C30. B2, on the other hand, had fewer splits and
symptoms, such as emotional exhaustion after work, smaller decreases in impurity compared to B4. B4’s high
job-home life interference, irritability, anxiety, mood purity score was a result of a moderate positive correlation
swings, feeling on-edge, fatigue upon waking, feeling (0.5) between B14 and C30, whereas B2’s lower purity score
at wits’ end, depersonalization, and callousness. In reflected a lower positive correlation (0.4) between B2 and
addition, the plots revealed that most participants scored C30. Although B4’s high node purity score indicates its
similarly for these variables. However, three outliers were strong predictive power, it does not explain variability in
identified, indicating that these participants rated their C30 because it lacks a clear relationship with the target
organizations and burnout differently from the other variable.
participants. The separation of data points demonstrates The MDS plot revealed that most participants scored
that Model 1 is accurately classifying the participants differently from each other on questions related to
and their scores. understanding patients’ and visitors’ feelings, retaking
In Model 2, where question C30 served as the DV and one’s current job, feeling stimulated when working
was measured by questions B2, B3, B4, B13, B14, B16, and with colleagues, effectively handling problems, feeling
B18, two variables were tested at each split, with MSE used relaxed while managing emotional problems, and feeling
exhilarated when working with and talking to patients.
Several outlying participants were identified, as evidenced
by data points that were not clustered. The separation of
data points suggests that Model 2 is accurately classifying
the data.
Table 3. Variable of importance of Model 2
Importance Variable Increase in node purity
1. B4 12.81
2. B16 9.65
3. B13 7.13
4. B18 6.83
5. B14 6.65
6. B3 4.34
Figure 1. Multidimensional scaling plot for Model 1
Abbreviation: Dim: Dimension. 7. B2 3.43
Volume 2 Issue 3 (2025) 84 doi: 10.36922/aih.5127