
Page 45 - AIH-2-4
P. 45
Artificial Intelligence in Health ViT for neurodegeneration diagnosis
A B C
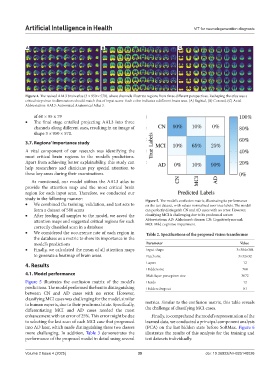
Figure 4. The resized AAL3 brain atlas (3 × 950 × 570), where channels illustrate regions from three different perspectives. Reshaping the atlas was a
critical step since its dimensions should match that of input scans. Each color indicates a different brain area. (A) Sagittal, (B) Coronal, (C) Axial.
Abbreviation: AAL3: Automated Anatomical Atlas 3.
of 60 × 95 × 79
• The final stage entailed projecting AAL3 into three
channels along different axes, resulting in an image of
shape 3 × 950 × 570.
3.7. Regions’ importance study
A vital component of our research was identifying the
most critical brain regions to the model’s predictions.
Apart from achieving better explainability, this study can
help researchers and clinicians pay special attention to
these key areas during their examinations.
As mentioned, our model utilizes the AAL3 atlas to
provide the attention map and the most critical brain
region for each input scan. Therefore, we conducted our
study in the following manner: Figure 5. The model’s confusion matrix, illustrating its performance
• We combined the training, validation, and test sets to on the test dataset, with values normalized over true labels. The model
form a dataset of 580 scans can perfectly distinguish CN and AD cases with no error. However,
• After feeding all samples to the model, we saved the classifying MCI is challenging due to its prodromal nature.
attention maps and suggested critical regions for each Abbreviations: AD: Alzheimer’s disease; CN: Cognitively normal;
MCI: Mild cognitive impairment.
correctly classified scan in a database
• We considered the occurrence rate of each region in Table 2. Specifications of the proposed vision transformer
the database as a metric to show its importance in the
model’s predictions Parameter Value
• Finally, we calculated the mean of all attention maps Input shape 3×384×384
to generate a heatmap of brain areas. Patch size 3×32×32
4. Results Layers 12
Hidden size 768
4.1. Model performance Multilayer perceptron size 3072
Figure 5 illustrates the confusion matrix of the model’s Heads 12
predictions. The model performed the best in distinguishing Hidden dropout 0.1
between CN and AD cases with no error. However,
classifying MCI cases was challenging for the model, similar
to human experts, due to their prodromal state. Specifically, metrics. Similar to the confusion matrix, this table reveals
differentiating MCI and AD cases needed the most the challenge of classifying MCI cases.
enhancement with an error of 25%. This error might be due Finally, to comprehend the model’s representation of the
to selecting the last scan of each MCI case that progressed learned data, we conducted a principal component analysis
into AD later, which made distinguishing these two classes (PCA) on the last hidden state before SoftMax. Figure 6
more challenging. In addition, Table 3 demonstrates the illustrates the results of this analysis for the training and
performance of the proposed model in detail using several test datasets individually.
Volume 2 Issue 4 (2025) 39 doi: 10.36922/AIH025140026