
Page 46 - AIH-2-4
P. 46
Artificial Intelligence in Health ViT for neurodegeneration diagnosis
Table 3. The performance of the proposed model per class using different classification metrics
Class Sensitivity Specificity Precision F1 score Accuracy (95% CI)
CN 0.90 0.95 0.90 0.90 82% (72%, 91%)
MCI 0.65 0.90 0.76 0.70
AD 0.90 0.88 0.78 0.84
Macro-average 0.82 0.91 0.81 0.81
Abbreviations: AD: Alzheimer’s disease; CI: Confidence interval; CN: Cognitively normal; MCI: Mild cognitive impairment.
A B
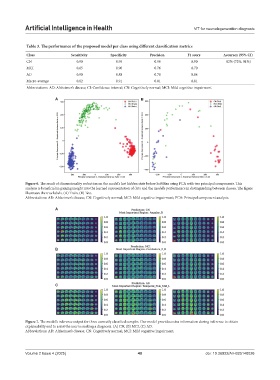
Figure 6. The result of dimensionality reduction on the model’s last hidden state before SoftMax using PCA with two principal components. This
analysis is beneficial in gaining insight into the learned representation of data and the model’s performance in distinguishing between classes. The figure
illustrates the true labels. (A) Train, (B) Test.
Abbreviations: AD: Alzheimer’s disease; CN: Cognitively normal; MCI: Mild cognitive impairment; PCA: Principal component analysis.
A
B
C
Figure 7. The model’s inference output for three correctly classified samples. Our model provides extra information during inference to obtain
explainability and to assist the user in making a diagnosis. (A) CN, (B) MCI, (C) AD.
Abbreviations: AD: Alzheimer’s disease; CN: Cognitively normal; MCI: Mild cognitive impairment.
Volume 2 Issue 4 (2025) 40 doi: 10.36922/AIH025140026