
Page 47 - AIH-2-4
P. 47
Artificial Intelligence in Health ViT for neurodegeneration diagnosis
4.2. Explainability distinguishing the CN class. In addition, the temporal pole
Figure 7 illustrates the prediction results of three correctly is the key area in classifying AD, aligning with previous
classified scans. As depicted, the model provides the studies that found all AD patients experience atrophy
42
following information to the user in the inference mode: and other complications in this brain region. Finally, the
• The predicted label proposed model defines the cerebellum as the essential area
• The brain region that has the most influence on the for MCI classification. Traditionally, this part of the brain
did not play a pivotal role in diagnosing NDDs. However,
43
model’s prediction. This information results from recent studies have revealed the significance of the
locating the pixel with the highest intensity value in an cerebellum in diagnosing MCI and various stages of AD.
43
overlay of the attention map and the AAL3 brain atlas
• An overlay of the attention map and the input scan, in Further investigations also indicate that AD progression
causes cerebellar transformations, and this region is
which the brightness of each pixel is analogous to its central to obtaining significantly better performance in
significance in the model’s conclusion. Red rectangles classification tasks. 44
also illustrate regions with attention values greater
than 95% of the maximum attention. Figure 9 shows the brain heatmaps, where the
brightness of a pixel signifies its impact on the model’s
In addition to the predicted label, this information decisions. As indicated in both figures, some brain regions
enables domain experts to find out the model’s logic and play a substantial role in diagnosing various classes.
examine the brain’s key areas further.
5. Discussion
4.3. Regions’ importance study
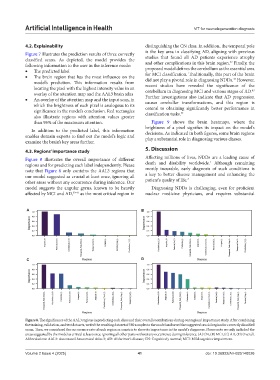
Figure 8 illustrates the overall importance of different Affecting millions of lives, NDDs are a leading cause of
1
regions and for predicting each label independently. Please death and disability worldwide. Although remaining
note that Figure 8 only contains the AAL3 regions that mostly incurable, early diagnosis of such conditions is
our model suggested as crucial at least once, ignoring all a key to better disease management and enhancing the
2
other areas without any occurrence during inference. Our patient’s quality of life.
model suggests the angular gyrus, known to be heavily Diagnosing NDDs is challenging, even for proficient
affected by MCI and AD, 39-41 as the most critical region in nuclear medicine physicians, and requires substantial
A B
C D
Figure 8. The significance of the AAL3 regions in predicting each class and their overall contributions during our regions’ importance study. After combining
the training, validation, and test datasets, we fed the resulting dataset of 580 samples to the model and saved the suggested crucial region for correctly classified
scans. Then, we considered the occurrence rate of each region as a metric to show its importance in the model’s diagnoses. Please note we only included the
areas suggested by the model as critical at least once, ignoring all other parts without any occurrence during inference. (A) CN, (B) MCI, (C) AD, (D) Overall.
Abbreviations: AAL3: Automated Anatomical Atlas 3; AD: Alzheimer’s disease; CN: Cognitively normal; MCI: Mild cognitive impairment.
Volume 2 Issue 4 (2025) 41 doi: 10.36922/AIH025140026