
Page 175 - AJWEP-22-4
P. 175
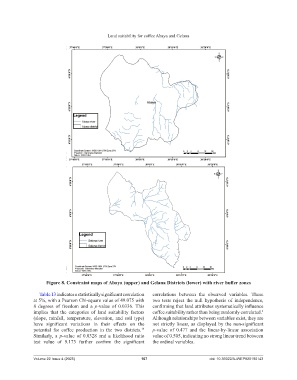
Land suitability for coffee Abaya and Gelana


                     Figure 8. Constraint maps of Abaya (upper) and Gelana Districts (lower) with river buffer zones


                  Table 13 indicates a statistically significant correlation   correlations  between  the  observed variables.  These
                at 5%, with a Pearson Chi-square value of 49.075 with   two tests reject  the null hypothesis of independence,
                8  degrees  of freedom  and  a  p-value  of 0.0336.  This   confirming that land attributes systematically influence
                implies  that  the  categories  of land  suitability  factors   coffee suitability rather than being randomly correlated.
                                                                                                                    3
                (slope, rainfall, temperature, elevation,  and soil type)   Although relationships between variables exist, they are
                have  significant  variations  in  their  effects  on  the   not strictly linear, as displayed by the non-significant
                potential  for  coffee  production  in  the  two  districts.    p-value  of 0.477 and  the  linear-by-linear  association
                                                               13
                Similarly, a  p-value  of 0.0328 and a likelihood  ratio   value of 0.505, indicating no strong linear trend between
                test  value  of  9.173  further  confirm  the  significant   the ordinal variables.


                Volume 22 Issue 4 (2025)                       167                           doi: 10.36922/AJWEP025190143