
Page 171 - AJWEP-22-4
P. 171
Land suitability for coffee Abaya and Gelana
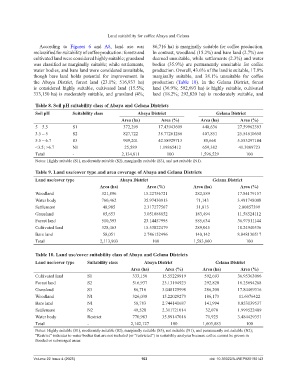
According to Figures 6 and A8, land use was 86,716 ha) is marginally suitable for coffee production.
reclassified for suitability of coffee production: forests and In contrast, woodland (15.2%) and bare land (2.7%) are
cultivated land were considered highly suitable; grassland deemed unsuitable, while settlements (2.3%) and water
was classified as marginally suitable; while settlements, bodies (35.9%) are permanently unsuitable for coffee
water bodies, and bare land were considered unsuitable, production. Overall, 43.6% of the land is suitable, 17.9%
though bare land holds potential for improvement. In marginally suitable, and 38.1% unsuitable for coffee
the Abaya District, forest land (23.1%; 516,937 ha) production (Table 10). In the Gelana District, forest
is considered highly suitable, cultivated land (15.5%; land (36.9%; 592,693 ha) is highly suitable, cultivated
333,150 ha) is moderately suitable, and grassland (4%; land (18.2%; 292,820 ha) is moderately suitable, and
Table 8. Soil pH suitability class of Abaya and Gelana Districts
Soil pH Suitability class Abaya District Gelana District
Area (ha) Area (%) Area (ha) Area (%)
5 – 5.5 S1 372,299 17.43943609 440,636 27.59962393
3.5 – 5 S2 827,722 38.77261266 407,851 25.54610658
5.5 – 6.7 S3 909,201 42.58929713 88,660 5.553297184
<3.5; >6.7 N1 25,589 1.19865412 659,382 41.3009723
Total - 2,134,811 100 1,596,529 100
Notes: Highly suitable (S1), moderately suitable (S2), marginally suitable (S3), and not suitable (N1).
Table 9. Land use/cover type and area coverage of Abaya and Gelana Districts
Land use/cover type Abaya District Gelana District
Area (ha) Area (%) Area (ha) Area (%)
Woodland 321,896 15.22756721 282,589 17.84179157
Water body 760,462 35.97430913 71,143 3.491748008
Settlement 48,985 2.317277567 31,813 2.00857399
Grassland 85,653 3.051888852 183,494 11.58524112
Forest land 510,393 23.14457995 585,634 36.97511144
Cultivated land 328,463 15.53822479 289,045 18.24940336
Bare land 58,051 2.746152496 140,142 8.848130517
Total 2,113,903 100 1,583,860 100
Table 10. Land use/cover suitability class of Abaya and Gelana Districts
Land use/cover type Suitability class Abaya District Gelana District
Area (ha) Area (%) Area (ha) Area (%)
Cultivated land S1 333,150 15.55229919 592,693 36.95363066
Forest land S2 516,937 23.13194923 292,820 18.25694268
Grassland S3 86,716 3.048125998 286,208 17.84469316
Woodland N1 326,038 15.22029273 186,173 11.6076422
Bare land N1 58,783 2.744141687 141,994 8.853139537
Settlement N2 49,520 2.311721014 32,070 1.999522409
Water body Restrict 770,983 35.99147016 71,925 3.484429351
Total - 2,142,127 100 1,603,883 100
Notes: Highly suitable (S1), moderately suitable (S2), marginally suitable (S3), not suitable (N1), and permanently not suitable (N2);
“Restrict” indicates to water bodies that are not included (or “restricted”) in suitability analyses because coffee cannot be grown in
flooded or submerged areas.
Volume 22 Issue 4 (2025) 163 doi: 10.36922/AJWEP025190143