
Page 199 - AJWEP-22-4
P. 199
Bombax ceiba-based carbons for dye removal
Corporation, USA) after degassing the samples at 150 °C due to the evaporation of physically adsorbed
300°C for 6 h under vacuum to determine specific water. This is associated with a mild endothermic
surface area, pore volume, and average pore diameter. dip in the DSC curve, reflecting energy absorption
These parameters were used to assess the adsorption during moisture loss.
potential of each sample. (ii) Active pyrolysis phase (~200 – 400°C): The major
decomposition phase occurred between 200°C and
2.4.7. Adsorption evaluation 400°C, accounting for a ~60% mass loss. This
Adsorption performance was evaluated using corresponds to the breakdown of hemicellulose
ultraviolet-Vis spectrophotometry (SCINCO Mega- (200 – 300°C) and cellulose (300 – 400°C). The
11
2100, double beam at 554 nm with a 1 cm quartz strong exothermic peak in the DSC curve indicates
cuvette; SCINCO Co., Ltd., South Korea) by monitoring significant heat release during pyrolytic degradation
RhB concentration changes during batch experiments. and volatile matter evolution.
Absorbance data were used to calculate dye removal (iii) Optimal carbonization zone (~400°C): Around
percentages under various conditions. 400°C, a sharp decline in the TGA curve and an
intense exothermic peak in the DSC profile signaled
3. Results and discussion the completion of cellulose degradation and the onset
of lignin breakdown. This temperature marks the
10
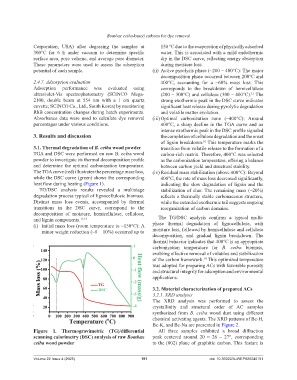
3.1. Thermal degradation of B. ceiba wood powder transition from volatile release to the formation of a
TGA and DSC were performed on raw B. ceiba wood carbon-rich matrix. Therefore, 400°C was selected
powder to investigate its thermal decomposition profile as the carbonization temperature, offering a balance
and determine the optimal carbonization temperature. between carbon yield and structural stability.
The TGA curve (red) illustrates the percentage mass loss, (iv) Residual mass stabilization (above 400°C): Beyond
while the DSC curve (green) shows the corresponding 400°C, the rate of mass loss decreased significantly,
heat flow during heating (Figure 1). indicating the slow degradation of lignin and the
TG/DSC analysis results revealed a multistage stabilization of char. The remaining mass (~20%)
degradation process typical of lignocellulosic biomass. reflects a thermally stable carbonaceous structure,
Distinct mass loss events, accompanied by thermal while the extended exothermic tail suggests ongoing
transitions in the DSC curve, correspond to the reorganization of carbon domains.
decomposition of moisture, hemicellulose, cellulose,
and lignin components. 11,13 The TG/DSC analysis confirms a typical multi-
(i) Initial mass loss (room temperature to ~150°C): A phase thermal degradation of lignocellulose, with
minor weight reduction (~8 – 10%) occurred up to moisture loss, followed by hemicellulose and cellulose
decomposition, and gradual lignin breakdown. The
thermal behavior indicates that 400°C is an appropriate
carbonization temperature for B. ceiba biomass,
enabling effective removal of volatiles and stabilization
of the carbon framework. This optimized temperature
14
was adopted for preparing ACs with favorable porosity
and structural integrity for adsorption and environmental
applications.
3.2. Material characterization of prepared ACs
3.2.1. XRD analysis
The XRD analysis was performed to assess the
crystallinity and structural order of AC samples
synthesized from B. ceiba wood dust using different
chemical activating agents. The XRD patterns of Bc-H,
Bc-K, and Bc-Na are presented in Figure 2.
Figure 1. Thermogravimetric (TG)/differential All three samples exhibited a broad diffraction
scanning calorimetry (DSC) analysis of raw Bombax peak centered around 2θ ≈ 26 – 27°, corresponding
ceiba wood powder to the (002) plane of graphitic carbon. This feature is
Volume 22 Issue 4 (2025) 191 doi: 10.36922/AJWEP025240191