
Page 129 - AJWEP-22-6
P. 129
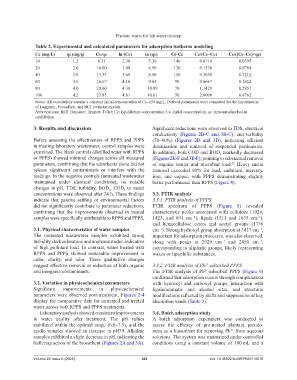
Plantain waste for lab water cleanup

                 Table 2. Experimental and calculated parameters for adsorption isotherm modeling
                 Ce (mg/L)    qe(mg/g)     Ce/qe     ln (Ce)     ln (qe)    Cs−Ce      Ce/(Cs−Ce)     Ce/([Cs−Ce]×qe)

                 10              1.2        8.33       2.30       5.30        140        0.0714           0.0595
                 20              2.0        10.00      3.00       6.90        130        0.1538           0.0769
                 40              3.0        13.33      3.69       8.50        110        0.3636           0.1212
                 60              3.6        16.67      4.10       9.43        90         0.6667           0.1852
                 80              4.0        20.00      4.38       10.09       70         1.1429           0.2857
                 100             4.2        23.81      4.61       10.61       50         2.0000           0.4762
                 Notes: All calculations assume a constant initial concentration of Cs=150 mg/L. Derived parameters were computed for the linearization
                 of Langmuir, Freundlich, and BET isotherm models.
                 Abbreviations: BET: Brunauer–Emmett–Teller; Ce: Equilibrium concentration; Cs: Initial concentration; qe: Amount adsorbed at
                 equilibrium.

                3. Results and discussion                           Significant reductions were observed in TDS, electrical
                                                                    conductivity  (Figures  2B-C  and  3B-C), and  turbidity
                Before  assessing  the  effectiveness  of  RPPS  and  PPPS   (70–90%) (Figures  2D and  3D),  indicating  efficient
                in treating laboratory wastewater, control samples were   deionization  and removal  of suspended particulates.
                examined. The blank controls (distilled water with RPPS   In addition, both COD and BOD  markedly decreased
                                                                                                  5
                or PPPS) showed minimal changes across all measured   (Figures 2E-F and 3E-F), pointing to substantial removal
                parameters, confirming that the adsorbents alone did not   of organic  matter  and microbial  load.  Heavy metal
                                                                                                       35
                release  significant  contaminants  or  interfere  with  the   removal  exceeded 90% for lead, cadmium,  mercury,
                readings. In the negative controls (untreated wastewater   iron, and copper, with PPPS  demonstrating  slightly
                maintained under identical conditions), no notable   better performance than RPPS (Figure 4).
                changes in pH, TDS, turbidity, BOD , COD, or metal
                                                 5
                concentrations were observed after 24 h. These findings   3.3. FTIR analysis
                indicate that passive settling or environmental factors   3.3.1. FTIR analysis of PPPS
                did not significantly contribute to parameter reductions,   FTIR spectrum of PPPS (Figure  5) revealed
                confirming  that  the  improvements  observed  in  treated   characteristic peaks associated with cellulose (1026,
                samples were specifically attributable to RPPS and PPPS.  1423,  and  891  cm⁻¹),  lignin  (1511  and  1635  cm⁻¹),
                                                                    and hemicellulose esters and acetyl groups (1736
                3.1. Physical characteristics of water samples      cm⁻¹). Strong hydroxyl group absorption at 3417 cm⁻¹,
                The untreated wastewater samples exhibited  strong   important for adsorption processes, was also observed,
                turbidity, dark coloration, and unpleasant odor, indicative   along  with  peaks  at  2920  cm⁻¹  and  2850  cm⁻¹,
                of high pollutant load. In contrast, water treated with   corresponding to aliphatic groups, likely representing
                RPPS  and PPPS  showed noticeable  improvement  in   waxes or lipophilic substances.
                color, clarity, and odor.  These qualitative  changes
                suggest effective removal or reduction of both organic   3.3.2. FTIR analysis of Pb -adsorbed PPPS
                                                                                           2+
                and inorganic contaminants.                         The FTIR analysis of Pb²⁺-adsorbed PPPS (Figure 6)
                                                                    confirmed that adsorption occurs through complexation
                3.2. Variation in physicochemical parameters        with hydroxyl and carboxyl groups, interaction  with
                Significant   improvements   in   physicochemical   lignin/aromatic  and alcohol sites, and structural
                parameters were observed post-treatment. Figures 2-4   modifications reflected by shifts and suppression of key
                display the comparative data for untreated and treated   absorption bands (Table 3).
                water across both RPPS and PPPS treatments.
                  Laboratory analysis showed consistent improvements   3.4. Batch adsorption study
                in water quality after treatment.  The pH values    A batch adsorption experiment was conducted  to
                stabilized within the optimal range (6.0–7.5), and the   assess  the  efficacy  of  pre-treated  plantain  pseudo-
                acidic samples showed an increase in pH39. Alkaline   stem as a biosorbent for removing Pb²⁺ from aqueous
                samples exhibited a slight decrease in pH, indicating the   solutions. The system was maintained under controlled
                buffering action of the biosorbent (Figures 2A and 3A).   conditions  using  a  constant  volume  of  100 mL  and  a


                Volume 22 Issue 6 (2025)                       123                           doi: 10.36922/AJWEP025110078