
Page 132 - AJWEP-22-6
P. 132
Kuppusamy and Dhanasamy
Figure 5. FTIR spectrum of PPPS
Abbreviations: FTIR: Fourier transform infrared spectroscopy; PPPS: Powdered plantain pseudo-stem
Figure 6. FTIR spectrum of Pb -adsorbed PPPS
2+
Abbreviations: FTIR: Fourier transform infrared spectroscopy; Pb: Lead; PPPS: Powdered plantain pseudo-stem
Where, qe = Amount of adsorbate adsorbed at
equilibrium (mg/g)
q = Maximum monolayer adsorption capacity (mg/g)
max
KL = Langmuir adsorption constant related to the
affinity of the binding sites (L/mg)
Ce = Equilibrium concentration of adsorbate in
solution (mg/L).
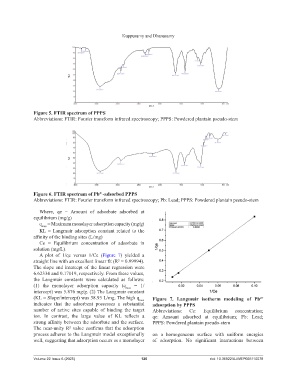
A plot of 1/qe versus 1/Ce (Figure 7) yielded a
straight line with an excellent linear fit (R² = 0.99994).
The slope and intercept of the linear regression were
6.62334 and 0.17019, respectively. From these values,
the Langmuir constants were calculated as follows:
(1) the monolayer adsorption capacity (q max = 1/
intercept) was 5.876 mg/g. (2) The Langmuir constant
(KL = Slope/intercept) was 38.93 L/mg. The high q max Figure 7. Langmuir isotherm modeling of Pb
2+
indicates that the adsorbent possesses a substantial adsorption by PPPS
number of active sites capable of binding the target Abbreviations: Ce: Equilibrium concentration;
ion. In contrast, the large value of KL reflects a qe: Amount adsorbed at equilibrium; Pb: Lead;
strong affinity between the adsorbate and the surface. PPPS: Powdered plantain pseudo-stem
The near-unity R² value confirms that the adsorption
process adheres to the Langmuir model exceptionally on a homogeneous surface with uniform energies
well, suggesting that adsorption occurs as a monolayer of adsorption. No significant interactions between
Volume 22 Issue 6 (2025) 126 doi: 10.36922/AJWEP025110078