
Page 133 - AJWEP-22-6
P. 133
Plantain waste for lab water cleanup
adsorbed molecules were observed, further supporting
the validity of the Langmuir assumptions.
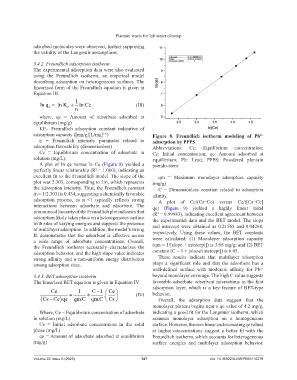
3.4.2. Freundlich adsorption isotherm
The experimental adsorption data were also evaluated
using the Freundlich isotherm, an empirical model
describing adsorption on heterogeneous surfaces. The
linearized form of the Freundlich equation is given in
Equation III.
ln q ln K 1 In Ce (III)
e F
n
where, qe = Amount of adsorbate adsorbed at
equilibrium (mg/g)
KF= Freundlich adsorption constant indicative of
adsorption capacity ([mg/g][L/mg] ) Figure 8. Freundlich isotherm modeling of Pb
1/n
2+
n = Freundlich intensity parameter related to adsorption by PPPS
adsorption favorability (dimensionless) Abbreviations: Ce: Equilibrium concentration;
Ce = Equilibrium concentration of adsorbate in Cs: Initial concentration; qe: Amount adsorbed at
solution (mg/L). equilibrium; Pb: Lead; PPPS: Powdered plantain
A plot of ln qe versus ln Ce (Figure 8) yielded a pseudo-stem
perfectly linear relationship (R² = 1.000), indicating an
excellent fit to the Freundlich model. The slope of the qm = Maximum monolayer adsorption capacity
plot was 2.303, corresponding to 1/n, which represents (mg/g)
the adsorption intensity. Thus, the Freundlich constant C = Dimensionless constant related to adsorption
(n = 1/2.303) is 0.434, suggesting a chemically favorable affinity.
adsorption process, as n <1 typically reflects strong A plot of Ce/(Cs−Ce) versus Ce/([Cs−Ce]
interactions between adsorbate and adsorbent. The qe) (Figure 9) yielded a highly linear trend
pronounced linearity of the Freundlich plot indicates that (R = 0.99983), indicating excellent agreement between
2
adsorption likely takes place on a heterogeneous surface the experimental data and the BET model. The slope
with sites of varying energies and supports the presence
of multilayer adsorption. In addition, the model’s strong and intercept were obtained as 0.21563 and 0.04268,
fit demonstrates that the adsorbent is effective across respectively. Using these values, the BET constants
a wide range of adsorbate concentrations. Overall, were calculated: (1) Monolayer adsorption capacity
the Freundlich isotherm accurately characterizes the (qm = 1/[slope + intercept]) is 3.98 mg/g; and (2) BET
adsorption behavior, and the high slope value indicates constant (C = 1 + [slope/intercept]) is 6.05.
strong affinity and a non-uniform energy distribution These results indicate that multilayer adsorption
among adsorption sites. plays a significant role and that the adsorbent has a
well-defined surface with moderate affinity for Pb²⁺
3.4.3. BET adsorption isotherm beyond monolayer coverage. The high C value suggests
The linearized BET equation is given in Equation IV. favorable adsorbate–adsorbent interactions in the first
adsorption layer, which is a key feature of BET-type
Ce 1 C 1 Ce (IV) behavior.
.
Cs Ce qe qm C . qm C Cs Overall, the adsorption data suggest that the
.
monolayer plateau begins near a qe value of 4.2 mg/g,
Where, Ce = Equilibrium concentration of adsorbate indicating a good fit for the Langmuir isotherm, which
in solution (mg/L) assumes monolayer adsorption on a homogeneous
Cs = Initial adsorbate concentration in the solid surface. However, the non-linear and increasing qevalues
phase (mg/L) at higher concentrations suggest a better fit with the
qe = Amount of adsorbate adsorbed at equilibrium Freundlich isotherm, which accounts for heterogeneous
(mg/g) surface energies and multilayer adsorption behavior.
Volume 22 Issue 6 (2025) 127 doi: 10.36922/AJWEP025110078