
Page 134 - AJWEP-22-6
P. 134
Kuppusamy and Dhanasamy
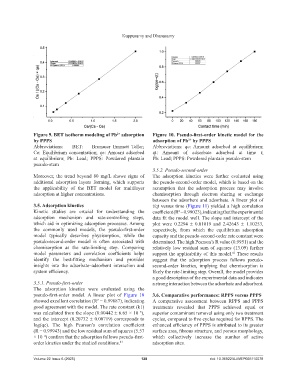
Figure 9. BET isotherm modeling of Pb adsorption Figure 10. Pseudo-first-order kinetic model for the
2+
by PPPS adsorption of Pb by PPPS
2+
Abbreviations: BET: Brunauer–Emmett–Teller; Abbreviations: qe: Amount adsorbed at equilibrium;
Ce: Equilibrium concentration; qe: Amount adsorbed qt: Amount of adsorbate adsorbed at time t;
at equilibrium; Pb: Lead; PPPS: Powdered plantain Pb: Lead; PPPS: Powdered plantain pseudo-stem
pseudo-stem
3.5.2. Pseudo-second-order
Moreover, the trend beyond 80 mg/L shows signs of The adsorption kinetics were further evaluated using
additional adsorption layers forming, which supports the pseudo-second-order model, which is based on the
the applicability of the BET model for multilayer assumption that the adsorption process may involve
adsorption at higher concentrations. chemisorption through electron sharing or exchange
between the adsorbent and adsorbate. A linear plot of
3.5. Adsorption kinetics t/qt versus time (Figure 11) yielded a high correlation
Kinetic studies are crucial for understanding the coefficient (R = 0.99023), indicating that the experimental
2
adsorption mechanism and rate-controlling steps, data fit the model well. The slope and intercept of the
which aid in optimizing adsorption processes. Among plot were 0.2294 ± 0.01019 and 2.42643 ± 1.10253,
the commonly used models, the pseudo-first-order respectively, from which the equilibrium adsorption
model typically describes physisorption, while the capacity and the pseudo-second-order rate constant were
pseudo-second-order model is often associated with determined. The high Pearson’s R value (0.9951) and the
chemisorption as the rate-limiting step. Comparing relatively low residual sum of squares (13.09) further
model parameters and correlation coefficients helps support the applicability of this model. These results
41
identify the best-fitting mechanism and provides suggest that the adsorption process follows pseudo-
insights into the adsorbate–adsorbent interaction and second-order kinetics, implying that chemisorption is
system efficiency. likely the rate-limiting step. Overall, the model provides
a good description of the experimental data and indicates
3.5.1. Pseudo-first-order a strong interaction between the adsorbate and adsorbent.
The adsorption kinetics were evaluated using the
pseudo-first-order model. A linear plot of Figure 10 3.6. Comparative performance: RPPS versus PPPS
showed excellent correlation (R = 0.99887), indicating A comparative assessment between RPPS and PPPS
2
good agreement with the model. The rate constant (k1) treatments revealed that PPPS achieved equal or
was calculated from the slope (0.00442 ± 6.65 × 10⁻⁵), superior contaminant removal using only two treatment
and the intercept (0.20732 ± 0.00719) corresponds to cycles, compared to five cycles required for RPPS. The
log(qe). The high Pearson’s correlation coefficient enhanced efficiency of PPPS is attributed to its greater
(R = 0.99943) and the low residual sum of squares (5.57 surface area, fibrous structure, and porous morphology,
× 10⁻⁴) confirm that the adsorption follows pseudo-first- which collectively increase the number of active
order kinetics under the studied conditions. 41 adsorption sites.
Volume 22 Issue 6 (2025) 128 doi: 10.36922/AJWEP025110078