
Page 130 - AJWEP-22-6
P. 130
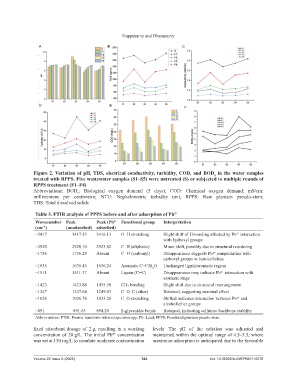
Kuppusamy and Dhanasamy

                  A                             B                                C


                  D                              E                                F


                Figure 2. Variation of pH, TDS, electrical conductivity, turbidity, COD, and BOD  in the water samples
                                                                                               5
                treated with RPPS. Five wastewater samples (S1–S5) were untreated (S) or subjected to multiple rounds of
                RPPS treatment (F1–F4)
                Abbreviations: BOD : Biological  oxygen demand (5  days); COD: Chemical oxygen demand; mS/cm:
                                   5
                millisiemens  per centimetre; NTU: Nephelometric  turbidity  unit;  RPPS: Raw plantain  pseudo-stem;
                TDS: Total dissolved solids

                 Table 3. FTIR analysis of PPPS before and after adsorption of Pb 2+
                 Wavenumber  Peak          Peak (Pb²⁺  Functional group  Interpretation
                 (cm⁻¹)       (unadsorbed) adsorbed)
                 ~3417           3417.53   3416.13    O–H stretching     Slight shift of H-bonding affected by Pb²⁺ interaction
                                                                         with hydroxyl groups
                 ~2920           2920.10   2923.82    C–H (aliphatic)    Minor shift, possibly due to structural reordering
                 ~1736           1736.28   Absent     C=O (carbonyl)     Disappearance suggests Pb²⁺ complexation with
                                                                         carboxyl groups in hemicellulose
                 ~1635           1635.45   1636.24    Aromatic C=C/H O   Unchanged lignin/aromatic region
                                                                    2
                 ~1511           1511.37   Absent     Lignin (C=C)       Disappearance may indicate Pb²⁺ interaction with
                                                                         aromatic rings
                 ~1423           1423.84   1435.50    CH₂ bending        Slight shift due to structural rearrangement
                 ~1247           1247.64   1249.03    C–O–C (ether)      Retained, suggesting minimal effect
                 ~1026           1026.76   1033.26    C–O stretching     Shifted indicates interaction between Pb²⁺ and
                                                                         alcohol/ether groups
                 ~891            891.63    894.20     β-glycosidic bonds  Retained, indicating cellulose backbone stability
                 Abbreviations: FTIR: Fourier transform infrared spectroscopy; Pb: Lead; PPPS: Powdered plantain pseudo-stem.

                fixed  adsorbent  dosage  of  2 g,  resulting  in  a  working   levels.  The pH of the solution was adjusted and
                concentration of 20 g/L. The initial Pb²⁺ concentration   maintained within the optimal range of 4.5–5.5, where
                was set at 150 mg/L to simulate moderate contamination   maximum adsorption is anticipated due to the favorable


                Volume 22 Issue 6 (2025)                       124                           doi: 10.36922/AJWEP025110078