
Page 153 - AJWEP-22-6
P. 153
Water quality of Bharatpur, Nepal
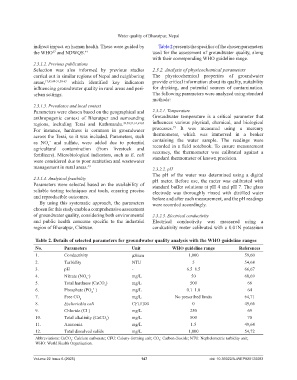
indirect impact on human health. These were guided by Table 2 presents the specifics of the chosen parameters
the WHO and NDWQS. 44 used for the assessment of groundwater quality, along
57
with their corresponding WHO guideline range.
2.3.1.2. Previous publications
Selection was also informed by previous studies 2.3.2. Analysis of physicochemical parameters
carried out in similar regions of Nepal and neighboring The physicochemical properties of groundwater
areas, 17,43,49-51,58-63 which identified key indicators provide critical information about its quality, suitability
influencing groundwater quality in rural areas and peri- for drinking, and potential sources of contamination.
urban settings. The following parameters were analyzed using standard
methods:
2.3.1.3. Prevalence and local context
Parameters were chosen based on the geographical and 2.3.2.1. Temperature
anthropogenic context of Bharatpur and surrounding Groundwater temperature is a critical parameter that
regions, including Terai and Kathmandu. 39,50,51,61,64,65 influences various physical, chemical, and biological
73
For instance, hardness is common in groundwater processes. It was measured using a mercury
across the Terai, so it was included. Parameters, such thermometer, which was immersed in a beaker
as NO and sulfate, were added due to potential containing the water sample. The readings were
−
3
agricultural contamination (from livestock and recorded in a field notebook. To ensure measurement
fertilizers). Microbiological indicators, such as E. coli accuracy, the thermometer was calibrated against a
were considered due to poor sanitation and wastewater standard thermometer of known precision.
management in rural areas. 43 2.3.2.2. pH
The pH of the water was determined using a digital
2.3.1.4. Analytical feasibility pH meter. Before use, the meter was calibrated with
Parameters were selected based on the availability of standard buffer solutions at pH 4 and pH 7. The glass
reliable testing techniques and tools, ensuring precise electrode was thoroughly rinsed with distilled water
and reproducible outcomes. before and after each measurement, and the pH readings
By using this systematic approach, the parameters were recorded accordingly.
chosen for this study enable a comprehensive assessment
of groundwater quality, considering both environmental 2.3.2.3. Electrical conductivity
and public health concerns specific to the industrial Electrical conductivity was measured using a
region of Bharatpur, Chitwan. conductivity meter calibrated with a 0.01N potassium
Table 2. Details of selected parameters for groundwater quality analysis with the WHO guideline ranges
No. Parameters Unit WHO guideline range References
1. Conductivity µS/cm 1,000 59,60
2. Turbidity NTU 5 54,68
3. pH - 6.5–8.5 66,67
4. Nitrate (NO ) mg/L 50 60,69
−
3
5. Total hardness (CaCO ) mg/L 500 66
3
6. Phosphate (PO ) mg/L 0.1–1.0 64
3−
4
7. Free CO mg/L No prescribed limits 64,71
2
8. Escherichia coli CFU/100 0 49,66
9. Chloride (Cl ) mg/L 250 69
−
10. Total alkalinity (CaCO ) mg/L 500 70
3
11. Ammonia mg/L 1.5 49,64
12. Total dissolved solids mg/L 1,000 54,72
Abbreviations: CaCO : Calcium carbonate; CFU: Colony-forming unit; CO : Carbon dioxide; NTU: Nephelometric turbidity unit;
2
3
WHO: World Health Organization.
Volume 22 Issue 6 (2025) 147 doi: 10.36922/AJWEP025120083