
Page 156 - AJWEP-22-6
P. 156
Yadav, et al.
Figure 3. Variation of water temperature in the
groundwater of Bharatpur
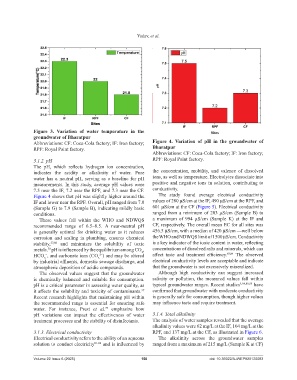
Abbreviations: CF: Coca-Cola factory; IF: Iron factory; Figure 4. Variation of pH in the groundwater of
RPF: Royal Paint factory. Bharatpur
Abbreviations: CF: Coca-Cola factory; IF: Iron factory;
3.1.2. pH RPF: Royal Paint factory.
The pH, which reflects hydrogen ion concentration,
indicates the acidity or alkalinity of water. Pure the concentration, mobility, and valence of dissolved
water has a neutral pH, serving as a baseline for pH ions, as well as temperature. Electrolytes dissociate into
measurements. In this study, average pH values were positive and negative ions in solution, contributing to
7.5 near the IF, 7.2 near the RPF, and 7.3 near the CF. conductivity.
Figure 4 shows that pH was slightly higher around the The study found average electrical conductivity
IF and lower near the RPF. Overall, pH ranged from 7.0 values of 280 µS/cm at the IF, 490 µS/cm at the RPF, and
(Sample G) to 7.9 (Sample B), indicating mildly basic 601 µS/cm at the CF (Figure 5). Electrical conductivity
conditions. ranged from a minimum of 203 µS/cm (Sample B) to
These values fall within the WHO and NDWQS a maximum of 994 µS/cm (Sample K) at the IF and
recommended range of 6.5–8.5. A near-neutral pH CF, respectively. The overall mean EC for all sites was
is generally optimal for drinking water as it reduces 456.5 µS/cm, with a median of 420 µS/cm —well below
corrosion and scaling in plumbing, ensures chemical the WHO and NDWQS limit of 1500 µS/cm. Conductivity
stability, 57,80 and minimizes the solubility of toxic is a key indicator of the ionic content in water, reflecting
metals. pH is influenced by the equilibrium among CO , concentrations of dissolved salts and minerals, which can
78
2
HCO , and carbonate ions (CO ) and may be altered affect taste and treatment efficiency. 83,84 The observed
−
2−
3
3
by industrial effluents, domestic sewage discharge, and electrical conductivity levels are acceptable and indicate
atmospheric deposition of acidic compounds. that the groundwater is not excessively mineralized.
The observed values suggest that the groundwater Although high conductivity can suggest increased
is chemically balanced and suitable for consumption. salinity or pollution, the measured values fall within
pH is a critical parameter in assessing water quality, as typical groundwater ranges. Recent studies 5,54,80,85 have
it affects the solubility and toxicity of contaminants. confirmed that groundwater with moderate conductivity
57
Recent research highlights that maintaining pH within is generally safe for consumption, though higher values
the recommended range is essential for ensuring safe may influence taste and require treatment.
water. For instance, Prest et al. emphasize how
77
pH variations can impact the effectiveness of water 3.1.4. Total alkalinity
treatment processes and the stability of disinfectants. The analysis of water samples revealed that the average
alkalinity values were 62 mg/L at the IF, 104 mg/L at the
3.1.3. Electrical conductivity RPF, and 137 mg/L at the CF, as illustrated in Figure 6.
Electrical conductivity refers to the ability of an aqueous The alkalinity across the groundwater samples
solution to conduct electricity 81-84 and is influenced by ranged from a maximum of 215 mg/L (Sample K at CF)
Volume 22 Issue 6 (2025) 150 doi: 10.36922/AJWEP025120083