Page 159 - AJWEP-22-6
P. 159

Water quality of Bharatpur, Nepal


                Figure 9. Variation of free CO  in the groundwater
                                             2
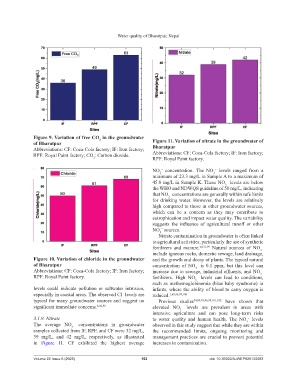
                of Bharatpur                                        Figure 11. Variation of nitrate in the groundwater of
                Abbreviations: CF: Coca-Cola factory; IF: Iron factory;   Bharatpur
                RPF: Royal Paint factory; CO : Carbon dioxide.      Abbreviations: CF: Coca-Cola factory; IF: Iron factory;
                                          2                         RPF: Royal Paint factory.

                                                                    NO  concentration.  The  NO  levels  ranged  from a
                                                                        −
                                                                                                −
                                                                       3
                                                                                               3
                                                                    minimum of 23.3 mg/L in Sample A to a maximum of
                                                                    45.8 mg/L in Sample K. These NO  levels are below
                                                                                                     −
                                                                                                    3
                                                                    the WHO and NDWQS guideline of 50 mg/L, indicating
                                                                    that NO  concentrations are generally within safe limits
                                                                            −
                                                                           3
                                                                    for drinking water. However, the levels are relatively
                                                                    high compared to those in other groundwater sources,
                                                                    which can be a concern  as they  may contribute  to
                                                                    eutrophication and impact water quality. The variability
                                                                    suggests  the  influence  of  agricultural  runoff  or  other
                                                                    NO  sources.
                                                                        −
                                                                       3
                                                                       Nitrate contamination in groundwater is often linked
                                                                    to agricultural activities, particularly the use of synthetic
                                                                    fertilizers  and manure. 64,71,99  Natural  sources of NO
                                                                                                                    −
                                                                                                                    3
                                                                    include igneous rocks, domestic sewage, land drainage,
                Figure 10. Variation of chloride in the groundwater   and the growth and decay of plants. The typical natural
                of Bharatpur                                        concentration  of NO  is 0.1  ppm, but this level  can
                                                                                        −
                                                                                       3
                Abbreviations: CF: Coca-Cola factory; IF: Iron factory;   increase due to sewage, industrial effluents, and NO
                                                                                                                    −
                                                                                                                    3
                RPF: Royal Paint factory.                           fertilizers.  High NO  levels can lead to conditions,
                                                                                        −
                                                                                       3
                                                                    such as methemoglobinemia (blue baby syndrome) in
                levels could indicate  pollution  or saltwater  intrusion,   infants, where the ability of blood to carry oxygen is
                especially in coastal areas. The observed Cl  levels are   reduced. 1,60,96,99,100
                                                       −
                typical for many groundwater sources and suggest no    Previous studies 54,89,93,96,99,101,102  have  shown that
                significant immediate concerns. 6,42,98             elevated  NO  levels  are prevalent  in areas with
                                                                                 −
                                                                                3
                                                                    intensive  agriculture and can pose long-term  risks
                3.1.9. Nitrate                                      to water quality and human health.  The NO  levels
                                                                                                              −
                                                                                                             3
                The average  NO  concentrations  in groundwater     observed in this study suggest that while they are within
                                 −
                                 3
                samples collected from IF, RPF, and CF were 32 mg/L,   the recommended limits,  ongoing monitoring and
                39  mg/L,  and 42  mg/L,  respectively, as illustrated   management practices are crucial to prevent potential
                in  Figure  11. CF exhibited  the highest average   increases in contamination.
                Volume 22 Issue 6 (2025)                       153                           doi: 10.36922/AJWEP025120083
   154   155   156   157   158   159   160   161   162   163   164