
Page 162 - AJWEP-22-6
P. 162
Yadav, et al.
3.3. Statistical analysis 3.3.2. Discussion of physicochemical parameters
All 12 samples from three sites, values were analyzed Water is a vital resource for all living organisms, and
using descriptive statistics. Maximum, minimum, mean, its management influences environmental, economic,
median, standard deviation, and range were calculated and social aspects. This study examined the physical,
from the observed values. The standard deviation chemical, and microbiological characteristics
indicates the spread of values from the mean, while of groundwater to assess its quality. The results
the median represents the middle value. The calculated (Tables S1-S4) highlight differences in groundwater
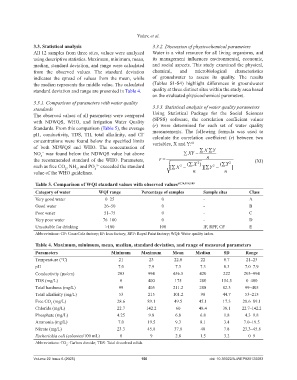
standard deviation and range are presented in Table 4. quality at three distinct sites within the study area based
on the evaluated physicochemical parameters.
3.3.1. Comparison of parameters with water quality
standards 3.3.3. Statistical analysis of water quality parameters
The observed values of all parameters were compared Using Statistical Package for the Social Sciences
with NDWQS, WHO, and Irrigation Water Quality (SPSS) software, the correlation coefficient values
Standards. From this comparison (Table 5), the average (r) were determined for each set of water quality
pH, conductivity, TDS, TH, total alkalinity, and Cl measurements. The following formula was used to
−
calculate the correlation coefficient (r) between two
concentrations were found below the specified limits variables, X and Y: 66
of both NDWQS and WHO. The concentration of ∑ ∑ X Y
NO was found below the NDWQS value but above ∑ − XY
−
3
the recommended standard of the WHO. Parameters, r = 2 n 2 (XI)
such as free CO , NH , and PO exceeded the standard [∑ 2 −X (∑ ) ][∑ 2 −Y (∑ X Y ]
3−
4
2
3
value of the WHO guidelines. n n
Table 3. Comparison of WQI standard values with observed values 60,74,108,109
Category of water WQI range Percentage of samples Sample sites Class
Very good water 0–25 0 - A
Good water 26–50 0 - B
Poor water 51–75 0 - C
Very poor water 76–100 0 - D
Unsuitable for drinking >100 100 IF, RPF, CF E
Abbreviations: CF: Coca-Cola factory; IF: Iron factory; RPF: Royal Paint factory; WQI: Water quality index.
Table 4. Maximum, minimum, mean, median, standard deviation, and range of measured parameters
Parameters Minimum Maximum Mean Median SD Range
Temperature (°C) 21 23 22.0 22 0.7 21–23
pH 7.0 7.9 7.3 7.3 0.3 7.0–7.9
Conductivity (µs/cm) 203 994 456.5 420 222 203–994
TDS (mg/L) 0 400 175 200 154.5 0–400
Total hardness (mg/L) 99 405 211.2 208 82.3 99–405
Total alkalinity (mg/L) 53 215 101.2 98 44.7 53–215
Free CO (mg/L) 28.6 89.1 49.5 45.1 17.3 28.6–89.1
2
Chloride (mg/L) 22.7 142.2 60 48.4 38.1 22.7–142.2
Phosphate (mg/L) 4.25 9.8 6.8 6.8 1.8 4.3–9.8
Ammonia (mg/L) 7.0 19.5 9.3 8.1 3.4 7.0–19.5
Nitrate (mg/L) 23.3 45.8 37.8 40 7.8 23.3–45.8
Escherichia coli (colonies/100 mL) 0 9 2.8 1.5 3.2 0–9
Abbreviations: CO : Carbon dioxide; TDS: Total dissolved solids.
2
Volume 22 Issue 6 (2025) 156 doi: 10.36922/AJWEP025120083