
Page 161 - AJWEP-22-6
P. 161
Water quality of Bharatpur, Nepal
A B
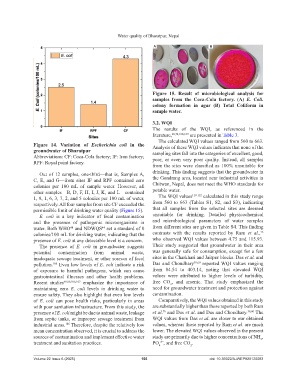
Figure 15. Result of microbiological analysis for
samples from the Coca-Cola factory. (A) E. Coli.
colony formation in agar (B) Total Coliform in
sample water.
3.2. WQI
The results of the WQI, as referenced in the
literature, 60,74,108,109 are presented in Table 3.
The calculated WQI values ranged from 560 to 663.
Figure 14. Variation of Escherichia coli in the Analysis of these WQI values indicates that none of the
groundwater of Bharatpur sampling sites fall into the categories of excellent, good,
Abbreviations: CF: Coca-Cola factory; IF: Iron factory; poor, or even very poor quality. Instead, all samples
RPF: Royal paint factory.
from the sites were classified as 100% unsuitable for
Out of 12 samples, one-third—that is, Samples A, drinking. This finding suggests that the groundwater in
C, E, and G—from sites IF and RPF contained zero the Gondrang area, located near industrial activities in
colonies per 100 mL of sample water. However, all Chitwan, Nepal, does not meet the WHO standards for
other samples—B, D, F, H, I, J, K, and L—contained potable water.
1, 9, 1, 6, 3, 7, 2, and 5 colonies per 100 mL of water, The WQI values 110-112 calculated in this study range
respectively. All four samples from site CF exceeded the from 560 to 663 (Tables S1, S2, and S3), indicating
permissible limit of drinking water quality (Figure 15). that all samples from the selected sites are deemed
E. coli is a key indicator of fecal contamination unsuitable for drinking. Detailed physicochemical
and the presence of pathogenic microorganisms in and microbiological parameters of water samples
water. Both WHO and NDWQS set a standard of 0 from different sites are given in Table S4. This finding
44
48
76
colonies/100 mL for drinking water, indicating that the contrasts with the results reported by Ram et al.,
presence of E. coli at any detectable level is a concern. who observed WQI values between 4.75 and 115.93.
The presence of E. coli in groundwater suggests Their study suggested that groundwater in their area
potential contamination from animal waste, was generally safe for consumption, except for a few
inadequate sewage treatment, or other sources of fecal sites in the Charkhari and Jaitpur blocks. Das et al. and
pollution. Even low levels of E. coli indicate a risk Das and Choudhary 59,60 reported WQI values ranging
106
of exposure to harmful pathogens, which can cause from 84.54 to 403.14, noting that elevated WQI
gastrointestinal illnesses and other health problems. values were attributed to higher levels of turbidity,
Recent studies 49,89,106,107 emphasize the importance of free CO , and arsenic. That study emphasized the
2
maintaining zero E. coli levels in drinking water to need for groundwater treatment and protection against
ensure safety. They also highlight that even low levels contamination.
of E. coli can pose health risks, particularly in areas Comparatively, the WQI values obtained in this study
with poor sanitation infrastructure. From this study, the are substantially higher than those reported by both Ram
presence of E. coli might be due to animal waste, leakage et al. and Das et al. and Das and Choudhary. 59,60 The
76
from septic tanks, or improper sewage treatment from WQI values from Das et al. are closer to our obtained
industrial areas. Therefore, despite the relatively low values, whereas those reported by Ram et al. are much
106
mean concentration observed, it is crucial to address the lower. The elevated WQI values observed in the present
sources of contamination and implement effective water study are primarily due to higher concentrations of NH ,
3
treatment and sanitation practices. PO , and free CO .
3−
4
2
Volume 22 Issue 6 (2025) 155 doi: 10.36922/AJWEP025120083