
Page 164 - AJWEP-22-6
P. 164
Yadav, et al.
that increased dissolved minerals (ions) contribute to
both parameters. The correlation between conductivity
and total alkalinity was also strong (r = 0.997, p=0.000),
likely due to the presence of CO and HCO , which
2−
−
3
3
contribute to both alkalinity and conductivity. A strong
positive correlation was observed between conductivity
and free CO (r = 0.980, p=0.003), signifying that CO
2
2
dissolution increases ion concentration, thus enhancing
conductivity through the formation of carbonic acid
or HCO . Moreover, Cl showed a strong positive
−
−
3
correlation with conductivity (r = 0.989, p=0.001),
consistent with the fact that Cl is highly conductive
−
in water. Similarly, a significant correlation existed
between conductivity and NH₃ (r = 0.971, p=0.006),
showing that NH increases conductivity by forming
3
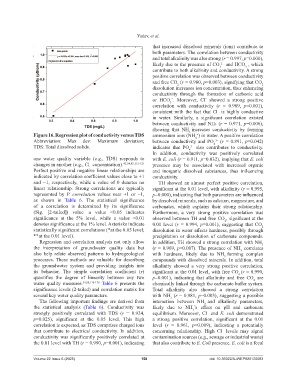
Figure 16. Regression plot of conductivity versus TDS ammonium ions (NH ) in water. A positive correlation
+
4
Abbreviation: Max dev: Maximum deviation; between conductivity and PO (r = 0.891, p=0.042)
3−
4
TDS: Total dissolved solids. indicates that PO also contributes to conductivity.
3−
4
In addition, conductivity was positively correlated
one water quality variable (e.g., TDS) responds to with E. coli (r = 0.911, p=0.032), implying that E. coli
changes in another (e.g., Cl concentration). 43,54,85,115-121 presence may be associated with increased organic
−
Perfect positive and negative linear relationships are and inorganic dissolved substances, thus influencing
indicated by correlation coefficient values close to +1 conductivity.
and −1, respectively, while a value of 0 denotes no TH showed an almost perfect positive correlation,
linear relationship. Strong correlations are typically significant at the 0.01 level, with alkalinity (r = 0.995,
represented by P. correlation values near +1 or −1, p=0.000), indicating that both parameters are influenced
as shown in Table 6. The statistical significance by dissolved minerals, such as calcium, magnesium, and
of a correlation is determined by its significance carbonates, which explains their strong relationship.
(Sig. [2-tailed]) value—a value <0.05 indicates Furthermore, a very strong positive correlation was
significance at the 5% level, while a value <0.01 observed between TH and free CO , significant at the
2
denotes significance at the 1% level. Asterisks indicate 0.01 level (r = 0.994, p=0.001), suggesting that CO
2
statistically significant correlations (*at the 0.05 level; dissolution in water affects hardness, possibly through
**at the 0.01 level). precipitation or dissolution of carbonate compounds.
Regression and correlation analysis not only allow In addition, TH showed a strong correlation with NH
3
the interpretation of groundwater quality data but (r = 0.969, p=0.007). The presence of NH correlates
3
also help relate observed patterns to hydrogeological with hardness, likely due to NH forming complex
3
processes. These methods are valuable for describing compounds with dissolved minerals. In addition, total
the groundwater system and providing insights into alkalinity showed a very strong positive correlation,
its behavior. The simple correlation coefficient (r) significant at the 0.01 level, with free CO (r = 0.990,
2
quantifies the degree of linearity between any two p=0.001), indicating that alkalinity and free CO are
2
water quality measures. 54,85,115-120 Table 6 presents the chemically linked through the carbonate buffer system.
significance levels (2-tailed) and correlation matrix for Total alkalinity also showed a strong correlation
several key water quality parameters. with NH (r = 0.981, p=0.003), suggesting a possible
3
The following important findings are derived from interaction between NH and alkalinity parameters,
3
the statistical analysis (Table 6). Conductivity was likely due to NH ’s effect on pH and carbonate
3
strongly positively correlated with TDS (r = 0.924, equilibrium. Moreover, Cl and E. coli demonstrated
−
p=0.025), significant at the 0.05 level. This high a strong positive correlation, significant at the 0.01
correlation is expected, as TDS comprises charged ions level (r = 0.961, p=0.009), indicating a potentially
that contribute to electrical conductivity. In addition, concerning relationship. High Cl levels may signal
−
conductivity was significantly positively correlated at contamination sources (e.g., sewage or industrial waste)
the 0.01 level with TH (r = 0.990, p=0.001), indicating that also contribute to E. Coli presence. E. coli is a fecal
Volume 22 Issue 6 (2025) 158 doi: 10.36922/AJWEP025120083