
Page 160 - AJWEP-22-6
P. 160
Yadav, et al.
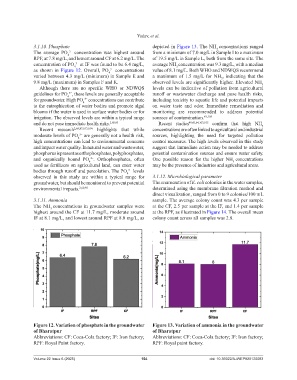
3.1.10. Phosphate depicted in Figure 13. The NH concentrations ranged
3
The average PO concentration was highest around from a minimum of 7.0 mg/L in Sample I to a maximum
3−
4
RPF, at 7.8 mg/L, and lowest around CF at 6.2 mg/L. The of 19.5 mg/L in Sample L, both from the same site. The
concentration of PO at IF was found to be 6.4 mg/L, average NH concentration was 9.3 mg/L, with a median
3−
3
4
as shown in Figure 12. Overall, PO concentrations value of 8.1 mg/L. Both WHO and NDWQS recommend
3−
4
varied between 4.3 mg/L (minimum) in Sample E and a maximum of 1.5 mg/L for NH , indicating that the
3
9.8 mg/L (maximum) in Samples F and K. observed levels are significantly higher. Elevated NH 3
Although there are no specific WHO or NDWQS levels can be indicative of pollution from agricultural
guidelines for PO , these levels are generally acceptable runoff or wastewater discharge and pose health risks,
3−
4
for groundwater. High PO concentrations can contribute including toxicity to aquatic life and potential impacts
3−
4
to the eutrophication of water bodies and promote algal on water taste and odor. Immediate remediation and
blooms if the water is used in surface water bodies or for monitoring are recommended to address potential
irrigation. The observed levels are within a typical range sources of contamination. 49,105
and do not pose immediate health risks. 2,60,93 Recent studies 49,43,64,103,105 confirm that high NH 3
Recent research 2,69,87,103,104 highlights that while concentrations are often linked to agricultural and industrial
moderate levels of PO are generally not a health risk, sources, highlighting the need for targeted pollution
3−
4
high concentrations can lead to environmental concerns control measures. The high levels observed in this study
and impact water quality. In natural water and wastewater, suggest that immediate action may be needed to address
phosphorus is present as orthophosphates, polyphosphates, potential contamination sources and ensure water safety.
and organically bound PO . Orthophosphates, often One possible reason for the higher NH concentrations
3−
4
3
used as fertilizers on agricultural land, can enter water may be the presence of industries and agricultural areas.
bodies through runoff and percolation. The PO levels
3−
4
observed in this study are within a typical range for 3.1.12. Microbiological parameter
groundwater, but should be monitored to prevent potential The enumeration of E. coli colonies in the water samples,
environmental impacts. 2,60,93 determined using the membrane filtration method and
direct visualization, ranged from 0 to 9 colonies/100 mL
3.1.11. Ammonia sample. The average colony count was 4.3 per sample
The NH concentrations in groundwater samples were at the CF, 2.5 per sample at the IF, and 1.4 per sample
3
highest around the CF at 11.7 mg/L, moderate around at the RPF, as illustrated in Figure 14. The overall mean
IF at 8.1 mg/L, and lowest around RPF at 8.0 mg/L, as colony count across all samples was 2.8.
Figure 12. Variation of phosphate in the groundwater Figure 13. Variation of ammonia in the groundwater
of Bharatpur of Bharatpur
Abbreviations: CF: Coca-Cola factory; IF: Iron factory; Abbreviations: CF: Coca-Cola factory; IF: Iron factory;
RPF: Royal Paint factory. RPF: Royal paint factory.
Volume 22 Issue 6 (2025) 154 doi: 10.36922/AJWEP025120083