Page 158 - AJWEP-22-6
P. 158

Yadav, et al.

                                                                    3.1.7. Free carbon dioxide
                                                                    The average concentrations of free CO in groundwater
                                                                                                       2
                                                                    samples  were  36  mg/L  at  IF,  49  mg/L  at  RPF,  and
                                                                    63 mg/L at CF, as illustrated in Figure 9. CF showed the
                                                                    highest average free CO  levels, followed by RPF, while
                                                                                         2
                                                                    IF had the lowest. The concentration of free CO  ranged
                                                                                                              2
                                                                    from a minimum of 28.6 mg/L at IF to a maximum of
                                                                    89.1 mg/L at CF, with Sample B from IF having the
                                                                    highest concentration and Sample K from CF the lowest.
                                                                       The primary sources of free CO  in water bodies are
                                                                                                   2
                                                                    respiration  and  decomposition  by  aquatic  organisms.
                                                                    CO  reacts  with water to partially  form calcium
                                                                       2
                                                                    bicarbonate;  in  the  absence  of  HCO ,  it  can  convert
                                                                                                      −
                                                                                                     3
                                                                    into CO , releasing additional CO . High levels of free
                                                                            2−
                                                                                                   2
                                                                           3
                                                                    CO  can contribute to the formation of carbonic acid,
                                                                       2
                                                                    affecting the pH and corrosiveness of water. Although
                Figure  7.  Variation of total hardness  in the     the WHO and NDWQS do not specify limits for CO ,
                                                                                                                    2
                groundwater of Bharatpur                            its  concentration  is  crucial  for  understanding  water
                Abbreviations: CF: Coca-Cola factory; IF: Iron factory;   chemistry. Regular monitoring is essential to assess its
                RPF: Royal Paint factory.                           impact  on  water  chemistry  and  infrastructure.  Recent
                                                                    studies  by  Khadka  and  Khanal   and  Budhathoki
                                                                                                  71
                                                                                                                    64
                                                                    highlight  that  elevated  free  CO  levels  can  indicate
                                                                                                  2
                                                                    high natural acidity or anthropogenic influences, such
                                                                    as contamination  from organic waste.  The observed
                                                                    CO  levels suggest a moderate presence, which is not
                                                                       2
                                                                    likely to cause immediate concern but warrants ongoing
                                                                    monitoring. 64,71
                                                                    3.1.8. Chloride
                                                                    Chloride  concentrations  were highest  around CF at
                                                                    68 mg/L, lowest around IF at 50 mg/L, and moderate
                                                                    around  RPF  at  61  mg/L,  as  shown  in  Figure  10. Cl
                                                                                                                    −
                                                                    levels ranged from a minimum of 22.7 mg/L in Sample
                                                                    B to a maximum of 142.2 mg/L in Sample K. The WHO
                                                                    and  NDWQS guideline  for Cl  in  drinking  water  is
                                                                                                −
                                                                    <250 mg/L, indicating that the observed levels are well
                                                                    within safe limits.
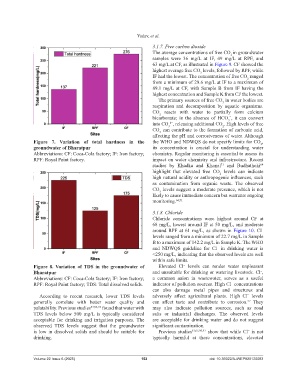
                Figure  8. Variation  of TDS in the groundwater of     Elevated  Cl  levels can render water unpleasant
                                                                                  −
                                                                                                                    −
                Bharatpur                                           and unsuitable for drinking or watering livestock. Cl ,
                Abbreviations: CF: Coca-Cola factory; IF: Iron factory;   a  common  anion  in  wastewater, serves as a  useful
                                                                                                       −
                RPF: Royal Paint factory; TDS: Total dissolved solids.  indicator of pollution sources. High Cl  concentrations
                                                                    can also damage  metal  pipes and structures and
                  According to recent research, lower  TDS levels   adversely  affect  agricultural  plants.  High  Cl  levels
                                                                                                              −
                                                                                                              57
                generally correlate with better water quality and   can  affect  taste  and  contribute  to  corrosion.  They
                palatability. Previous studies 43,94,95  found that water with   may also indicate  pollution sources, such as road
                TDS levels below 500  mg/L is typically considered   salts or industrial  discharges.  The observed levels
                acceptable for drinking and irrigation purposes.  The   are acceptable for drinking water and do not suggest
                observed  TDS levels suggest that the groundwater   significant contamination.
                is low in dissolved solids and should be suitable for   Previous studies 61,67,96,97  show that while Cl  is not
                                                                                                              −
                drinking.                                           typically  harmful  at  these  concentrations,  elevated


                Volume 22 Issue 6 (2025)                       152                           doi: 10.36922/AJWEP025120083
   153   154   155   156   157   158   159   160   161   162   163