
Page 163 - AJWEP-22-6
P. 163
Water quality of Bharatpur, Nepal
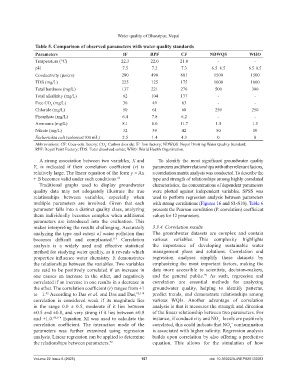
Table 5. Comparison of observed parameters with water quality standards
Parameters IF RPF CF NDWQS WHO
Temperature (°C) 22.3 22.0 21.8 - -
pH 7.5 7.2 7.3 6.5–8.5 6.5–8.5
Conductivity (µs/cm) 280 490 601 1500 1500
TDS (mg/L) 225 125 175 1000 1000
Total hardness (mg/L) 137 221 276 500 300
Total alkalinity (mg/L) 62 104 137 - -
Free CO (mg/L) 36 49 63 - -
2
Chloride (mg/L) 50 61 68 250 250
Phosphate (mg/L) 6.4 7.8 6.2 - -
Ammonia (mg/L) 8.1 8.0 11.7 1.5 1.5
Nitrate (mg/L) 32 39 42 50 10
Escherichia coli (colonies/100 mL) 2.5 1.4 4.3 0 0
Abbreviations: CF: Coca-cola factory; CO : Carbon dioxide; IF: Iron factory; NDWQS: Nepal Drinking Water Quality Standard;
2
RPF: Royal Paint Factory; TDS: Total dissolved solids; WHO: World Health Organization.
A strong association between two variables, X and To identify the most significant groundwater quality
Y, is indicated if their correlation coefficient (r) is parameters and their relationships with other relevant factors,
relatively large. The linear equation of the form y = Ax a correlation matrix analysis was conducted. To describe the
+ B becomes valid under such conditions. 66 type and strength of relationships among highly correlated
Traditional graphs used to display groundwater characteristics, the concentrations of dependent parameters
quality data may not adequately illustrate the true were plotted against independent variables. SPSS was
relationships between variables, especially when used to perform regression analysis between parameters
multiple parameters are involved. Given that each with strong correlations (Figures 16 and S1-S10). Table 6
parameter falls into a distinct quality class, analyzing presents the Pearson correlation (P. correlation) coefficient
them individually becomes complex when additional values for 12 parameters.
parameters are introduced into the evaluation. This
makes interpreting the results challenging. Accurately 3.3.4. Correlation results
analyzing the type and extent of water pollution thus The groundwater datasets are complex and contain
becomes difficult and complicated. Correlation various variables. This complexity highlights
113
analysis is a widely used and effective statistical the importance of developing sustainable water
method for studying water quality, as it reveals which management plans and solutions. Correlation and
properties influence water chemistry. It demonstrates regression analyses simplify these datasets by
the relationships between the variables. Two variables emphasizing the most important factors, making the
are said to be positively correlated if an increase in data more accessible to scientists, decision-makers,
96
one causes an increase in the other, and negatively and the general public. As such, regression and
correlated if an increase in one results in a decrease in correlation are essential methods for analyzing
the other. The correlation coefficient (r) ranges from +1 groundwater quality, helping to identify patterns,
to −1. According to Das et al. and Das and Das, 92,114 predict trends, and demonstrate relationships among
92
correlation is considered weak if its magnitude lies various WQIs. Another advantage of correlation
in the range 0.0 ± 0.5, moderate if it lies between analysis is that it measures the strength and direction
±0.5 and ±0.8, and very strong if it lies between ±0.8 of the linear relationship between two parameters. For
and ±1.0. 66,114 Equation XI was used to calculate the instance, if conductivity and NO levels are positively
−
3
correlation coefficient. The interaction mode of the correlated, this could indicate that NO contamination
−
3
parameters was further examined using regression is associated with higher salinity. Regression analysis
analysis. Linear regression can be applied to determine builds upon correlation by also offering a predictive
the relationships between parameters. 92 equation. This allows for the simulation of how
Volume 22 Issue 6 (2025) 157 doi: 10.36922/AJWEP025120083