Page 219 - AJWEP-22-6
P. 219

Assessment of the surface urban heat island

                defining the administrative boundaries of HCMC were        0.979 0.035−  Red                   NDVI  <  NDVI Min
                                                                       
                obtained  from local  government sources and used to   ε = 0.986 0.004P               NDVI+     ≤     NDVI≤ NDVI
                delineate the study area.                                          V            Min             Max
                                                                          0.99                                     NDVI  >  NDVI Max
                2.3. Data processing and analysis                                                                 (II)
                                                                                                                   13
                All image processing was conducted using established      where P  is determined from the following formula :
                                                                               v
                remote  sensing  algorithms  listed  below.  The  overall                    2
                research workflow is illustrated in Figure 2.        P     NDVI NDVI  Min                    (III)
                                                                      V
                (i)  Radiance  and  reflectance:  Digital  numbers  from     NDVI Max    NDVI Min
                   level  1 products were converted  to at-sensor       with NDVI   = 0.5, NDVI   = 0.2.
                                                                                                Min
                                                                                  Max
                   spectral radiance (L ) and then to top-of-atmosphere   (iv) LST: First, at-sensor brightness temperature (T ) was
                                     λ
                   planetary reflectance (ρ ), using the scaling factors   derived from the thermal band’s spectral radiance
                                        λ
                                                                                                                B
                   and formulas provided in the image metadata and      using Planck’s law inversion  with  metadata-
                   the Landsat Data Users Handbooks. 22,23  For Landsat   provided  constants.  LST  was then  calculated  in
                   5/7/8,  this  included  a  correction  for the  solar   Celsius by correcting T  for land surface emissivity
                   elevation angle.                                     using the following equation 24,25 :
                                                                                            B
                (ii)  NDVI: NDVI was calculated using the reflectance
                   of the red and near-infrared (NIR) bands, as per                 T B
                   Equation I:                                       LSTC       T        273 15.           (IV)
                                                                              1    B  α  ln ε()
                        ρ    ρ
                NDVI    Nir  Red                             (I)
                        ρ    ρ                                         where λ is the wavelength of the emitted radiance,
                         Nir  Red
                                                                        and α = hc/k (1.438 × 10  mK).
                                                                                              −2
                (iii) Land surface emissivity (ε): Land surface emissivity   (v)  Urban  thermal  field  variance  index  (UTFVI):  The
                   was estimated based on the NDVI-threshold method     UTFVI is used to assess the SUHI effect based on LST
                   described by Sobrino et al.  which assigns emissivity   and is divided into six levels of ecological evaluation
                                          9
                   values according to NDVI to differentiate between    (Table 2). It is calculated using Equation V 26-28 :
                   soil, vegetation, and mixed pixels.
                                                                     UTFVI   LSTLST   m                          (V)
                                                                                LST
                                                                                    m
                                                                        where LST is the  land  surface temperature  of
                                                                        each  pixel,  and  LST   is  the  mean  land  surface
                                                                                           m
                                                                        temperature of the study area.

                                                                    2.4. SUHI assessment and accuracy
                                                                    To comprehensively  evaluate  the  characteristics  and
                                                                    reliability of the SUHI patterns derived in this study, the
                                                                    following analytical steps were undertaken.
                                                                    (i)  SUHI  classification  and  analysis:  The  generated
                                                                        LST maps were classified into distinct thermal zones
                                                                        to facilitate analysis. Thresholds were defined based
                                                                        on the overall temperature  distribution for each
                                                                        year to represent relative thermal conditions: Low
                                                                        (<26°C),  moderate  (26–30°C),  high  (30–34°C),
                                                                        and very high (>34°C). The spatiotemporal trends,
                                                                        intensity, and expansion of the SUHI were assessed
                                                                        through qualitative  map  comparison,  calculation
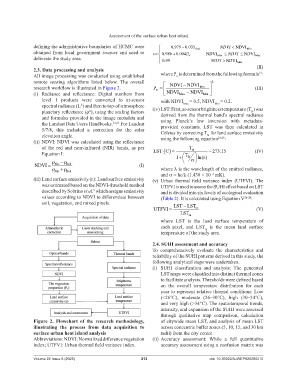
                Figure  2. Flowchart of the research methodology,       of citywide mean LST, and analysis of mean LST
                illustrating the process from data acquisition to       across concentric buffer zones (5, 10, 15, and 30 km
                surface urban heat island analysis                      radii) from the city center.
                Abbreviations: NDVI: Normalized difference vegetation   (ii)  Accuracy  assessment:  While  a full  quantitative
                index; UTFVI: Urban thermal field variance index.       accuracy assessment using a confusion matrix was


                Volume 22 Issue 6 (2025)                       213                           doi: 10.36922/AJWEP025260210
   214   215   216   217   218   219   220   221   222   223   224