
Page 223 - AJWEP-22-6
P. 223
Assessment of the surface urban heat island
This empirically validates the crucial role of vegetation strongly absorb solar radiation. In contrast, CLUHI
2
in mitigating urban heat through evapotranspirational is often most intense at night, as urban areas release
cooling and shading effects. 24,30 This finding has stored heat more slowly than rural surroundings
significant implications for urban planning in HCMC (Table 5). Our study focuses on SUHI, which provides
(Table 2). As the city continues to grow, the preservation a spatially comprehensive view of how different land
and strategic integration of green infrastructure—such use types affect the surface energy balance, which is the
as parks, green roofs, urban forests, and vegetated fundamental driver of the entire UHI phenomenon.
corridors—becomes paramount for thermal regulation
and for improving urban comfort and resilience. 31 4.4. Implications for urban planning and public
health
4.3. SUHI versus canopy layer UHI (CLUHI) The intensification of the SUHI in HCMC has several
It is important to distinguish between the SUHI, potential adverse consequences. These include
measured by satellite-derived LST, and the CLUHI, increased energy demand for cooling, which can strain
measured by in situ air temperature at weather stations. energy infrastructure and exacerbate greenhouse gas
SUHI reflects the temperature of surfaces (e.g., roads, emissions ; a heightened risk of heat-related health
32
rooftops), whereas CLUHI reflects the temperature of problems for urban residents, such as heat stress and heat
the air that people experience. SUHI typically exhibits stroke ; and negative impacts on local ecosystems and
33
a much greater thermal amplitude than CLUHI, with air quality. The expansion of the SUHI into suburban
24
peak intensity during the daytime when urban surfaces areas suggests that these previously less-affected regions
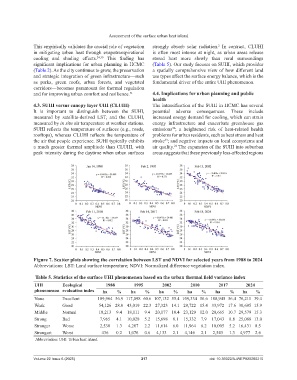
Figure 7. Scatter plots showing the correlation between LST and NDVI for selected years from 1988 to 2024
Abbreviations: LST: Land surface temperature; NDVI: Normalized difference vegetation index.
Table 5. Statistics of the surface UHI phenomenon based on the urban thermal field variance index
UHI Ecological 1988 1995 2002 2010 2017 2024
phenomenon evaluation index ha % ha % ha % ha % ha % ha %
None Excellent 109,964 56.9 117,098 60.6 107,132 55.4 109,334 56.6 108,945 56.4 76,211 39.4
Weak Good 54,126 28.0 43,019 22.3 27,323 14.1 29,722 15.4 33,972 17.6 30,695 15.9
Middle Normal 18,213 9.4 18,111 9.4 20,177 10.4 23,129 12.0 20,665 10.7 29,579 15.3
Strong Bad 7,965 4.1 10,028 5.2 15,698 8.1 15,332 7.9 17,043 8.8 25,088 13.0
Stronger Worse 2,530 1.3 4,207 2.2 11,614 6.0 11,964 6.2 10,005 5.2 16,431 8.5
Strongest Worst 436 0.2 1,076 0.6 4,133 2.1 4,146 2.1 2,543 1.3 4,977 2.6
Abbreviation: UHI: Urban heat island.
Volume 22 Issue 6 (2025) 217 doi: 10.36922/AJWEP025260210