
Page 220 - AJWEP-22-6
P. 220
Hao
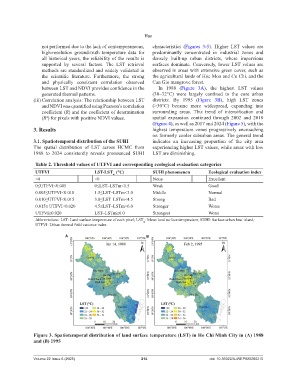
not performed due to the lack of contemporaneous, characteristics (Figures 3-5). Higher LST values are
high-resolution ground-truth temperature data for predominantly concentrated in industrial zones and
all historical years, the reliability of the results is densely built-up urban districts, where impervious
supported by several factors. The LST retrieval surfaces dominate. Conversely, lower LST values are
methods are standardized and widely validated in observed in areas with extensive green cover, such as
the scientific literature. Furthermore, the strong the agricultural lands of Hoc Mon and Cu Chi, and the
and physically consistent correlation observed Can Gio mangrove forest.
between LST and NDVI provides confidence in the In 1988 (Figure 3A), the highest LST values
generated thermal patterns. (30–32°C) were largely confined to the core urban
(iii) Correlation analysis: The relationship between LST districts. By 1995 (Figure 3B), high LST zones
and NDVI was quantified using Pearson’s correlation (>30°C) became more widespread, expanding into
coefficient (R) and the coefficient of determination surrounding areas. This trend of intensification and
(R ) for pixels with positive NDVI values. spatial expansion continued through 2002 and 2010
2
(Figure 4), as well as 2017 and 2024 (Figure 5), with the
3. Results highest temperature zones progressively encroaching
on formerly cooler suburban areas. The general trend
3.1. Spatiotemporal distribution of the SUHI indicates an increasing proportion of the city area
The spatial distribution of LST across HCMC from experiencing higher LST values, while areas with low
1988 to 2024 consistently reveals pronounced SUHI LST are diminishing.
Table 2. Threshold values of UTFVI and corresponding ecological evaluation categories
UTFVI LST-LST (°C) SUHI phenomenon Ecological evaluation index
m
<0 <0 None Excellent
0≤UTFVI<0.005 0≤LST–LSTm<1.5 Weak Good
0.005≤UTFVI<0.010 1.5≤LST–LSTm<3.0 Middle Normal
0.010≤UTFVI<0.015 3.0≤LST–LSTm<4.5 Strong Bad
0.015≤ UTFVI<0.020 4.5≤LST–LSTm<6.0 Stronger Worse
UTFVI≥0.020 LST–LSTm≥6.0 Strongest Worst
Abbreviations: LST: Land surface temperature of each pixel; LST : Mean land surface temperature; SUHI: Surface urban heat island;
m
UTFVI: Urban thermal field variance index.
A B
Figure 3. Spatiotemporal distribution of land surface temperature (LST) in Ho Chi Minh City in (A) 1988
and (B) 1995
Volume 22 Issue 6 (2025) 214 doi: 10.36922/AJWEP025260210