
Page 221 - AJWEP-22-6
P. 221
Assessment of the surface urban heat island
A B
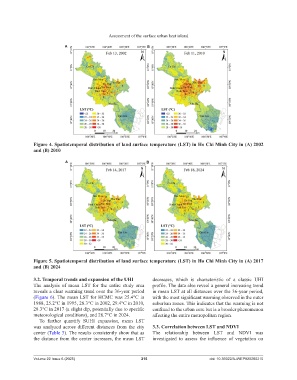
Figure 4. Spatiotemporal distribution of land surface temperature (LST) in Ho Chi Minh City in (A) 2002
and (B) 2010
A B
Figure 5. Spatiotemporal distribution of land surface temperature (LST) in Ho Chi Minh City in (A) 2017
and (B) 2024
3.2. Temporal trends and expansion of the UHI decreases, which is characteristic of a classic UHI
The analysis of mean LST for the entire study area profile. The data also reveal a general increasing trend
reveals a clear warming trend over the 36-year period in mean LST at all distances over the 36-year period,
(Figure 6). The mean LST for HCMC was 25.4°C in with the most significant warming observed in the outer
1988, 25.2°C in 1995, 28.3°C in 2002, 29.4°C in 2010, suburban zones. This indicates that the warming is not
28.3°C in 2017 (a slight dip, potentially due to specific confined to the urban core but is a broader phenomenon
meteorological conditions), and 28.7°C in 2024. affecting the entire metropolitan region.
To further quantify SUHI expansion, mean LST
was analyzed across different distances from the city 3.3. Correlation between LST and NDVI
center (Table 3). The results consistently show that as The relationship between LST and NDVI was
the distance from the center increases, the mean LST investigated to assess the influence of vegetation on
Volume 22 Issue 6 (2025) 215 doi: 10.36922/AJWEP025260210