
Page 222 - AJWEP-22-6
P. 222
Hao
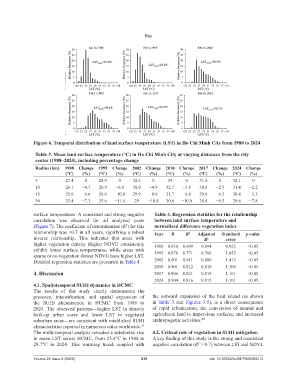
Figure 6. Temporal distribution of land surface temperature (LST) in Ho Chi Minh City from 1988 to 2024
Table 3. Mean land surface temperature (°C) in Ho Chi Minh City at varying distances from the city
center (1988–2024), including percentage change
Radius (km) 1988 Change 1995 Change 2002 Change 2010 Change 2017 Change 2024 Change
(°C) (%) (°C) (%) (°C) (%) (°C) (%) (°C) (%) (°C) (%)
5 27.4 0 28.9 0 32.5 0 34 0 31.6 0 32.1 0
10 26.1 −4.7 26.9 −6.9 30.9 −4.9 32.7 −3.8 30.8 −2.5 31.4 −2.2
15 25.6 −6.6 26.0 −10.0 29.9 −8.0 31.7 −6.8 29.6 −6.3 30.4 −5.3
30 25.4 −7.3 25.6 −11.4 29 −10.8 30.6 −10.0 28.6 −9.5 29.6 −7.8
surface temperatures. A consistent and strong negative Table 4. Regression statistics for the relationship
correlation was observed for all analyzed years between land surface temperature and
(Figure 7). The coefficient of determination (R ) for this normalized difference vegetation index
2
relationship was >0.7 in all years, signifying a robust Year R R 2 Adjusted Standard p-value
inverse relationship. This indicates that areas with R 2 error
higher vegetation density (higher NDVI) consistently 1988 0.836 0.699 0.694 0.923 <0.05
exhibit lower surface temperatures, while areas with 1995 0.878 0.771 0.768 1.055 <0.05
sparse or no vegetation (lower NDVI) have higher LST.
Detailed regression statistics are presented in Table 4. 2002 0.901 0.811 0.809 1.412 <0.05
2010 0.901 0.812 0.810 1.300 <0.05
4. Discussion 2017 0.906 0.821 0.819 1.161 <0.05
2024 0.904 0.816 0.815 1.101 <0.05
4.1. Spatiotemporal SUHI dynamics in HCMC
The results of this study clearly demonstrate the
presence, intensification, and spatial expansion of the outward expansion of the heat island (as shown
the SUHI phenomenon in HCMC from 1988 to in Table 3 and Figures 3-5), is a direct consequence
2024. The observed patterns—higher LST in densely of rapid urbanization, the conversion of natural and
built-up urban cores and lower LST in vegetated agricultural land to impervious surfaces, and increased
suburban areas—are consistent with established SUHI anthropogenic activities. 20
characteristics reported in numerous cities worldwide.
29
The multi-temporal analysis revealed a substantial rise 4.2. Critical role of vegetation in SUHI mitigation
in mean LST across HCMC, from 25.4°C in 1988 to A key finding of this study is the strong and consistent
28.7°C in 2024. This warming trend, coupled with negative correlation (R > 0.7) between LST and NDVI.
2
Volume 22 Issue 6 (2025) 216 doi: 10.36922/AJWEP025260210