
Page 229 - AJWEP-22-6
P. 229
FVC and climate in Yarkand Basin
A B C
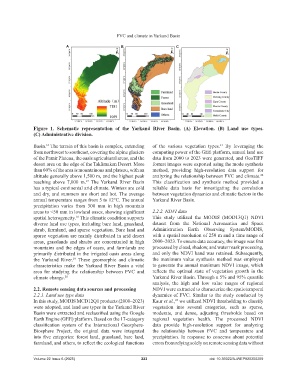
Figure 1. Schematic representation of the Yarkand River Basin. (A) Elevation. (B) Land use types.
(C) Administrative division.
Basin. The terrain of this basin is complex, extending of the various vegetation types. By leveraging the
21
16
from northwest to southeast, covering the alpine glaciers computing power of the GEE platform, annual land use
of the Pamir Plateau, the oasis agricultural areas, and the data from 2000 to 2023 were generated, and GeoTIFF
desert area on the edge of the Taklimakan Desert. More format images were exported using the mode synthesis
than 60% of the area is mountainous and plateau, with an method, providing high-resolution data support for
altitude generally above 1,500 m, and the highest peak analyzing the relationship between FVC and climate.
22
reaching above 7,000 m. The Yarkand River Basin This classification and synthesis method provided a
17
has a typical continental arid climate. Winters are cold reliable data basis for investigating the correlation
and dry, and summers are short and hot. The average between vegetation dynamics and climatic factors in the
annual temperature ranges from 5 to 12°C. The annual Yarkand River Basin.
precipitation varies from 300 mm in high mountain
areas to <50 mm in lowland oases, showing significant 2.2.2. NDVI data
spatial heterogeneity. This climatic condition supports This study utilized the MODIS (MOD13Q1) NDVI
18
diverse land use types, including bare land, grassland, dataset from the National Aeronautics and Space
shrub, farmland, and sparse vegetation. Bare land and Administration Earth Observing System/MODIS,
sparse vegetation are mainly distributed in arid desert with a spatial resolution of 250 m and a time range of
areas, grasslands and shrubs are concentrated in high 2000–2023. To ensure data accuracy, the image was first
mountains and the edges of oases, and farmlands are processed by cloud, shadow, and water mask processing,
primarily distributed in the irrigated oasis areas along and only the NDVI band was retained. Subsequently,
the Yarkand River. These geomorphic and climatic the maximum value synthesis method was employed
19
characteristics make the Yarkand River Basin a vital to generate the annual maximum NDVI image, which
area for studying the relationship between FVC and reflects the optimal state of vegetation growth in the
climate change. 20 Yarkand River Basin. Through a 5% and 95% quantile
analysis, the high and low value ranges of regional
2.2. Remote sensing data sources and processing NDVI were extracted to characterize the spatiotemporal
2.2.1. Land use type data dynamics of FVC. Similar to the study conducted by
In this study, MODIS MCD12Q1 products (2000–2023) Kaur et al., we utilized NDVI thresholding to classify
23
were adopted, and land use types in the Yarkand River vegetation into several categories, such as sparse,
Basin were extracted and reclassified using the Google moderate, and dense, adjusting thresholds based on
Earth Engine (GEE) platform. Based on the 17-category regional vegetation health. The processed NDVI
classification system of the International Geosphere- data provide high-resolution support for analyzing
Biosphere Project, the original data were integrated the relationship between FVC and temperature and
into five categories: forest land, grassland, bare land, precipitation. In response to concerns about potential
farmland, and others, to reflect the ecological functions errors from relying solely on remote sensing data without
Volume 22 Issue 6 (2025) 223 doi: 10.36922/AJWEP025350269