
Page 232 - AJWEP-22-6
P. 232
Qin, et al.
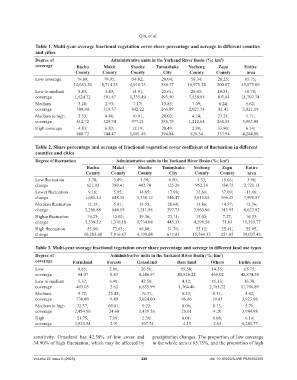
Table 1. Multi‑year average fractional vegetation cover share percentage and acreage in different counties
and cities
Degree of Administrative units in the Yarkand River Basin (%; km )
2
coverage Bachu Makit Shache Tumushuke Yecheng Zepu Entire
County County County City County County area
Low coverage 79.80; 79.95; 54.82; 20.04; 59.34; 20.25; 65.75;
14,683.20 8,714.55 4,910.23 386.17 16,971.24 200.07 45,875.09
Low to medium 8.83; 5.43; 14.91; 25.61; 26.43; 10.51; 16.78;
coverage 1,624.72 591.87 1,335.49 493.50 7,558.98 103.84 11,707.74
Medium 3.20; 2.93; 7.17; 13.85; 7.09; 8.24; 5.62;
coverage 588.80 319.37 642.22 266.89 2,027.74 81.41 3,921.19
Medium to high 3.33; 4.86; 10.91; 20.02; 4.24; 27.21; 5.71;
coverage 612.72 529.74 977.21 385.79 1,212.64 268.83 3,983.98
High coverage 4.83; 6.83; 12.19; 20.49; 2.89; 33.80; 6.14;
888.72 744.47 1,091.86 394.84 826.54 333.94 4,284.00
Table 2. Share percentage and acreage of fractional vegetation cover coefficient of fluctuation in different
counties and cities
Degree of fluctuation Administrative units in the Yarkand River Basin (%; km )
2
Bachu Makit Shache Tumushuke Yecheng Zepu Entire
County County County City County County area
Low fluctuation 3.38; 3.49; 5.39; 6.50; 3.33; 15.66; 3.90;
change 621.92 380.41 482.78 125.26 952.38 154.72 2,721.11
Lower fluctuation 9.16; 5.95; 14.85; 17.98; 12.64; 37.09; 11.46;
change 1,685.44 648.55 1,330.12 346.47 3,615.04 366.45 7,995.87
Medium fluctuation 12.32; 5.91; 13.53; 20.64; 13.86; 14.57; 12.36;
change 2,266.88 644.19 1,211.88 397.73 3,963.96 143.95 8,623.82
Higher fluctuation 19.23; 12.02; 19.36; 23.11; 15.03; 7.27; 16.33;
change 3,538.32 1,310.18 1,734.08 445.33 4,298.58 71.83 11,393.77
High fluctuation 55.90; 72.63; 46.88; 31.76; 55.12; 25.41; 55.95;
change 10,285.60 7,916.67 4,199.04 612.02 15,764.32 251.05 39,037.43
Table 3. Multi‑year average fractional vegetation cover share percentage and acreage in different land use types
Degree of Administrative units in the Yarkand River Basin (%; km )
2
coverage Farmland Forests Grassland Bare land Others Entire area
Low 0.85; 2.06; 26.56; 95.58; 14.35; 65.75;
coverage 64.07 0.83 4,146.97 40,918.22 469.02 45,874.50
Low to medium 5.32; 6.48; 42.50; 4.12; 85.13; 16.78;
coverage 403.03 2.62 6,635.99 1,764.40 2,781.72 11,706.89
Medium 9.72; 23.45; 19.37; 0.23; 0.31; 5.62;
coverage 736.80 9.49 3,024.00 96.46 10.03 3,923.86
Medium to high 32.37; 60.81; 9.22; 0.06; 0.13; 5.71;
coverage 2,454.50 24.60 1,439.56 26.01 4.20 3,984.98
High 51.75; 7.19; 2.36; 0.01; 0.08; 6.14;
coverage 3,923.54 2.91 367.74 4.15 2.63 4,281.77
sensitivity. Grassland has 42.50% of low cover and precipitation changes. The proportion of low coverage
34.90% of high fluctuation, which may be affected by in the whole area is 65.75%, and the proportion of high
Volume 22 Issue 6 (2025) 226 doi: 10.36922/AJWEP025350269