
Page 233 - AJWEP-22-6
P. 233
FVC and climate in Yarkand Basin
Table 4. Share percentage and acreage of fractional vegetation cover coefficient of fluctuation in different
land use types
Degree of fluctuation Administrative units in the Yarkand River Basin (%; km )
2
Farmland Forests Grassland Bare land Others Entire area
Low fluctuation 23.02; 22.18; 2.71; 0.73; 7.49; 3.90;
change 1,741.53 11.82 423.27 312.08 243.17 2,719.20
Lower fluctuation 33.55; 46.16; 13.70; 4.50; 39.25; 11.46;
change 2,538.08 24.60 2,138.89 1,919.62 1,274.88 7,994.74
Medium fluctuation 16.81; 21.24; 19.57; 6.90; 39.03; 12.36;
change 1,271.58 11.32 3,055.42 2,945.40 1,267.78 8,624.87
Higher fluctuation 13.10; 7.98; 29.12; 13.36; 0.63; 16.33;
change 991.01 4.25 4,547.28 5,704.27 20.63 11,394.23
High fluctuation 13.52; 2.44; 34.90; 74.51; 13.60; 55.95;
change 1,022.82 1.30 5,449.99 31,799.37 441.65 39,038.96
A B
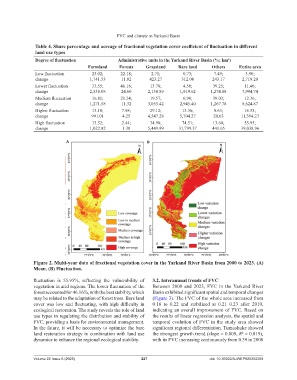
Figure 2. Multi-year data of fractional vegetation cover in the Yarkand River Basin from 2000 to 2023. (A)
Mean. (B) Fluctuation.
fluctuation is 55.95%, reflecting the vulnerability of 3.2. Interannual trends of FVC
vegetation in arid regions. The lower fluctuation of the Between 2000 and 2023, FVC in the Yarkand River
forest accounted for 46.16%, with the best stability, which Basin exhibited significant spatial and temporal changes
may be related to the adaptation of forest trees. Bare land (Figure 3). The FVC of the whole area increased from
cover was low and fluctuating, with high difficulty in 0.16 to 0.22 and stabilized at 0.21–0.23 after 2010,
ecological restoration. The study reveals the role of land indicating an overall improvement of FVC. Based on
use types in regulating the distribution and stability of the results of linear regression analysis, the spatial and
FVC, providing a basis for environmental management. temporal evolution of FVC in the study area showed
In the future, it will be necessary to optimize the bare significant regional differentiation. Tumushuke showed
land restoration strategy in combination with land use the strongest growth trend (slope = 0.009, R = 0.819),
2
dynamics to enhance the regional ecological stability. with its FVC increasing continuously from 0.39 in 2000
Volume 22 Issue 6 (2025) 227 doi: 10.36922/AJWEP025350269