
Page 235 - AJWEP-22-6
P. 235
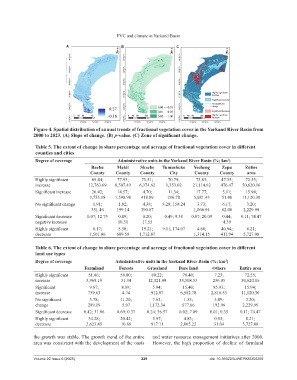
FVC and climate in Yarkand Basin

                              A                       B                        C


                Figure 4. Spatial distribution of annual trends of fractional vegetation cover in the Yarkand River Basin from
                2000 to 2023. (A) Slope of change. (B) p‑value. (C) Zone of significant change.

                 Table 5. The extent of change in share percentage and acreage of fractional vegetation cover in different
                 counties and cities
                 Degree of coverage                  Administrative units in the Yarkand River Basin (%; km )
                                                                                                     2
                                         Bachu       Makit     Shache    Tumushuke    Yecheng      Zepu      Entire
                                         County     County     County       City       County     County      area
                 Highly significant      69.44;      77.93;    71.51;      70.79;      73.83;     47.35;     72.55;
                 increase               12,763.69   8,507.49  6,374.62    1,353.02    21,114.62   476.47    50,620.16
                 Significant increase    20.42;      14.57;     4.70;      11.34;      17.77;      5.11;     15.94;
                                        3,753.18    1,590.98   418.89      216.70     5,081.43     51.40    11,120.30
                 No significant change    1.91;      1.82;      4.38;    8.28; 158.24   3.73;      6.17;      3.20;
                                         351.46     199.14     390.67                 1,066.94     62.06    2,229.99
                 Significant decrease   0.07; 12.73  0.09;      0.20;     0.49; 9.38  0.07; 20.09  0.44;   0.11; 74.47
                 negative increase                   10.31      17.55                              4.39
                 Highly significant       8.17;      5.58;     19.21;    9.11; 174.07   4.60;     40.94;      8.21;
                 decrease               1,501.06    609.59    1,712.87                1,314.15    411.94    5,727.08


                 Table 6. The extent of change in share percentage and acreage of fractional vegetation cover in different
                 land use types

                 Degree of coverage                 Administrative units in the Yarkand River Basin (%; km )
                                                                                                    2
                                      Farmland       Forests      Grassland     Bare land     Others      Entire area
                 Highly significant     51.86;        58.80;        80.22;       78.40;        7.23;         72.55;
                 increase              3,968.19       31.34       12,321.99     33,508.53      236.95      50,620.16
                 Significant            9.67;          8.89;        5.94;        15.40;        85.93;        15.94;
                 increase               739.63         4.74        912.07       6,582.78      2,816.53     11,120.30
                 No significant         3.78;         11.20;        7.63;         1.35;        5.89;         3.20;
                 change                 289.19         5.97        1,172.34      577.66        192.96       2,229.99
                 Significant decrease  0.42; 31.86   0.69; 0.37   0.24; 36.57   0.02; 7.09   0.01; 0.35    0.11; 74.47
                 Highly significant     34.28;        20.42;        5.97;         4.83;        0.95;         8.21;
                 decrease              2,623.45       10.88         917.11      2,065.22       31.04        5,727.08

                the growth was stable. The growth trend of the entire   and water resource management initiatives after 2000.
                area was consistent with the development of the oasis   However, the high proportion of decline  of farmland


                Volume 22 Issue 6 (2025)                       229                           doi: 10.36922/AJWEP025350269