
Page 240 - AJWEP-22-6
P. 240
Qin, et al.
A B C
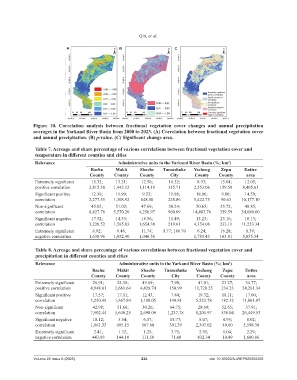
Figure 10. Correlation analysis between fractional vegetation cover changes and annual precipitation
averages in the Yarkand River Basin from 2000 to 2023. (A) Correlation between fractional vegetation cover
and annual precipitation. (B) p‑value. (C) Significant change area.
Table 7. Acreage and share percentage of various correlations between fractional vegetation cover and
temperature in different counties and cities
Relevance Administrative units in the Yarkand River Basin (%; km )
2
Bachu Makit Shache Tumushuke Yecheng Zepu Entire
County County County City County County area
Extremely significant 15.32; 13.21; 12.50; 16.52; 8.93; 15.84; 12.05;
positive correlation 2,815.38 1,442.12 1,114.18 315.71 2,553.06 159.50 8,405.63
Significant positive 12.39; 11.99; 9.52; 11.98; 18.96; 9.00; 14.59;
correlation 2,277.55 1,308.92 848.50 228.86 5,422.75 90.63 10,177.10
Non-significant 45.85; 51.02; 47.69; 50.24; 50.65; 35.72; 48.85;
correlation 8,427.78 5,570.20 4,250.97 960.09 14,483.76 359.59 34,080.60
Significant negative 17.52; 14.33; 18.56; 11.49; 15.23; 23.16; 16.13;
correlation 3,220.52 1,565.03 1,654.38 219.61 4,354.06 233.11 11,253.34
Extremely significant 8.92; 9.46; 11.74; 9.77; 186.70 6.24; 16.28; 8.39;
negative correlation 1,638.96 1,032.40 1,046.56 1,783.43 163.91 5,855.34
Table 8. Acreage and share percentage of various correlations between fractional vegetation cover and
precipitation in different counties and cities
Relevance Administrative units in the Yarkand River Basin (%; km )
2
Bachu Makit Shache Tumushuke Yecheng Zepu Entire
County County County City County County area
Extremely significant 26.91; 24.38; 49.69; 7.90; 41.01; 23.27; 34.77;
positive correlation 4,948.81 2,661.64 4,429.74 150.99 11,728.25 234.23 24,261.34
Significant positive 17.57; 17.11; 12.43; 7.84; 19.32; 18.11; 17.00;
correlation 3,230.48 1,867.84 1,108.05 149.81 5,523.78 182.32 11,861.97
Non-significant 42.98; 51.66; 30.26; 64.75; 28.69; 52.65; 37.91;
correlation 7,902.44 5,640.25 2,698.09 1,237.78 8,205.97 530.04 26,449.53
Significant negative 10.12; 5.54; 6.37; 15.77; 8.07; 4.93; 8.02;
correlation 1,861.33 605.15 567.68 301.39 2,307.02 49.60 5,598.30
Extremely significant 2.41; 1.32; 1.25; 3.75; 2.91; 1.04; 2.29;
negative correlation 443.88 144.10 111.50 71.68 832.34 10.49 1,600.86
Volume 22 Issue 6 (2025) 234 doi: 10.36922/AJWEP025350269