
Page 242 - AJWEP-22-6
P. 242
Qin, et al.
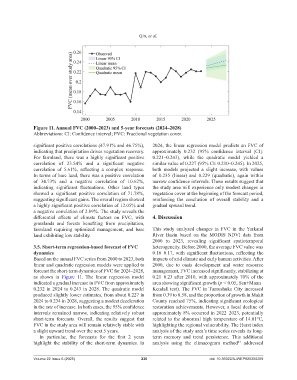
Figure 11. Annual FVC (2000–2023) and 5-year forecasts (2024–2028)
Abbreviations: CI: Confidence interval; FVC: Fractional vegetation cover.
significant positive correlations (47.91% and 46.75%), 2024, the linear regression model predicts an FVC of
indicating that precipitation drives vegetation recovery. approximately 0.232 (95% confidence interval [CI]:
For farmland, there was a highly significant positive 0.221–0.243), while the quadratic model yielded a
correlation of 23.54% and a significant negative similar value of 0.227 (95% CI: 0.210–0.245). In 2025,
correlation of 5.61%, reflecting a complex response. both models projected a slight increase, with values
In terms of bare land, there was a positive correlation of 0.235 (linear) and 0.229 (quadratic), again within
of 34.73% and a negative correlation of 10.62%, narrow confidence intervals. These results suggest that
indicating significant fluctuations. Other land types the study area will experience only modest changes in
showed a significant positive correlation of 71.78%, vegetation cover at the beginning of the forecast period,
suggesting significant gains. The overall region showed reinforcing the conclusion of overall stability and a
a highly significant positive correlation of 12.05% and gradual upward trend.
a negative correlation of 2.89%. The study reveals the
differential effects of climate factors on FVC, with 4. Discussion
grasslands and forests benefiting from precipitation,
farmland requiring optimized management, and bare This study analyzed changes in FVC in the Yarkand
land exhibiting low stability. River Basin based on the MODIS NDVI data from
2000 to 2023, revealing significant spatiotemporal
3.5. Short-term regression-based forecast of FVC heterogeneity. Before 2000, the average FVC value was
dynamics 0.16–0.17, with significant fluctuations, reflecting the
Based on the annual FVC series from 2000 to 2023, both impacts of arid climate and early human activities. After
linear and quadratic regression models were applied to 2000, due to oasis development and water resource
forecast the short-term dynamics of FVC for 2024–2028, management, FVC increased significantly, stabilizing at
as shown in Figure 11. The linear regression model 0.21–0.23 after 2010, with approximately 70% of the
indicated a gradual increase in FVC from approximately area showing significant growth (p < 0.05, Sen+Mann–
0.232 in 2024 to 0.243 in 2028. The quadratic model Kendall test). The FVC in Tumushuke City increased
produced slightly lower estimates, from about 0.227 in from 0.39 to 0.58, and the proportion of growth in Makit
2024 to 0.234 in 2028, suggesting a modest deceleration County reached 75%, indicating significant ecological
in the rate of increase. In both cases, the 95% confidence restoration achievements. However, a local decline of
intervals remained narrow, indicating relatively robust approximately 8% occurred in 2022–2023, potentially
short-term forecasts. Overall, the results suggest that related to the abnormal high temperature of 14.01°C,
FVC in the study area will remain relatively stable with highlighting the regional vulnerability. The Hurst index
a slight upward trend over the next 5 years. analysis of the study area’s time series reveals its long-
In particular, the forecasts for the first 2 years term memory and trend persistence. This additional
highlight the stability of the short-term dynamics. In analysis using the climacogram method addressed
41
Volume 22 Issue 6 (2025) 236 doi: 10.36922/AJWEP025350269