
Page 241 - AJWEP-22-6
P. 241
FVC and climate in Yarkand Basin
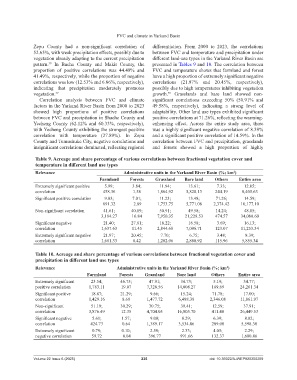
Zepu County had a non-significant correlation of differentiation. From 2000 to 2023, the correlations
52.65%, with weak precipitation effects, possibly due to between FVC and temperature and precipitation under
vegetation already adapting to the current precipitation different land-use types in the Yarkand River Basin are
pattern. In Bachu County and Makit County, the presented in Tables 9 and 10. The correlation between
39
proportion of positive correlations was 44.48% and FVC and temperature shows that farmland and forest
41.49%, respectively, while the proportion of negative have a high proportion of extremely significant negative
correlations was low (12.53% and 6.86%, respectively), correlations (21.97% and 20.45%, respectively),
indicating that precipitation moderately promotes possibly due to high temperatures inhibiting vegetation
vegetation. 37 growth. Grasslands and bare land showed non-
39
Correlation analysis between FVC and climate significant correlations exceeding 50% (50.91% and
factors in the Yarkand River Basin from 2000 to 2023 49.58%, respectively), indicating a strong level of
showed high proportions of positive correlations adaptability. Other land use types exhibited significant
between FVC and precipitation in Shache County and positive correlations at 71.26%, reflecting the warming-
Yecheng County (62.12% and 60.33%, respectively), enhancing effect. Across the entire study area, there
with Yecheng County exhibiting the strongest positive was a highly significant negative correlation of 8.39%
correlation with temperature (27.89%). In Zepu and a significant positive correlation of 14.59%. In the
County and Tumushuke City, negative correlations and correlation between FVC and precipitation, grasslands
insignificant correlations dominated, reflecting regional and forests showed a high proportion of highly
Table 9. Acreage and share percentage of various correlations between fractional vegetation cover and
temperature in different land use types
Relevance Administrative units in the Yarkand River Basin (%; km )
2
Farmland Forests Grassland Bare land Others Entire area
Extremely significant positive 5.99; 3.84; 11.94; 13.61; 7.33; 12.05;
correlation 458.36 1.58 1,864.92 5,828.13 244.19 8,405.63
Significant positive correlation 9.03; 7.01; 11.23; 13.48; 71.26; 14.59;
691.32 2.89 1,753.75 5,771.08 2,374.42 10,177.10
Non-significant correlation 41.61; 40.89; 50.91; 49.58; 14.24; 48.85;
3,184.27 16.84 7,950.35 21,228.53 474.57 34,080.60
Significant negative 21.40; 27.81; 18.22; 16.58; 3.69; 16.13;
correlation 1,637.63 11.45 2,844.68 7,096.71 123.07 11,253.34
Extremely significant negative 21.97; 20.45; 7.70; 6.75; 3.48; 8.39;
correlation 1,681.33 8.42 1,202.06 2,888.92 115.96 5,855.34
Table 10. Acreage and share percentage of various correlations between fractional vegetation cover and
precipitation in different land use types
Relevance Administrative units in the Yarkand River Basin (%; km )
2
Farmland Forests Grassland Bare land Others Entire area
Extremely significant 23.54; 46.75; 47.91; 34.73; 5.19; 34.77;
positive correlation 1,783.11 19.07 7,328.56 14,808.27 169.69 24,261.34
Significant positive 18.87; 21.29; 9.66; 15.24; 71.78; 17.00;
correlation 1,429.16 8.68 1,477.72 6,498.38 2,346.08 11,861.97
Non-significant 51.19; 30.29; 30.75; 39.41; 12.59; 37.91;
correlation 3,876.49 12.35 4,704.05 16,805.70 411.48 26,449.53
Significant negative 5.61; 1.57; 9.08; 8.29; 6.39; 8.02;
correlation 424.73 0.64 1,389.17 3,534.86 209.00 5,598.30
Extremely significant 0.79; 0.10; 2.59; 2.33; 4.05; 2.29;
negative correlation 59.72 0.04 396.77 991.66 132.37 1,600.86
Volume 22 Issue 6 (2025) 235 doi: 10.36922/AJWEP025350269