
Page 239 - AJWEP-22-6
P. 239
FVC and climate in Yarkand Basin
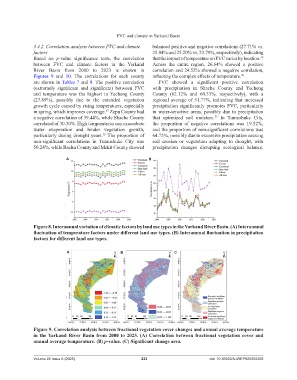
3.4.2. Correlation analysis between FVC and climate balanced positive and negative correlations (27.71% vs.
factors 25.84% and 25.20% vs. 23.79%, respectively), indicating
Based on p-value significance tests, the correlation that the impact of temperature on FVC varies by location.
39
between FVC and climate factors in the Yarkand Across the entire region, 26.64% showed a positive
River Basin from 2000 to 2023 is shown in correlation and 24.52% showed a negative correlation,
Figures 9 and 10. The correlations for each county reflecting the complex effects of temperature. 40
are shown in Tables 7 and 8. The positive correlation FVC showed a significant positive correlation
(extremely significant and significant) between FVC with precipitation in Shache County and Yecheng
and temperature was the highest in Yecheng County County (62.12% and 60.33%, respectively), with a
(27.89%), possibly due to the extended vegetation regional average of 51.77%, indicating that increased
growth cycle caused by rising temperatures, especially precipitation significantly promotes FVC, particularly
in spring, which improves coverage. Zepu County had in water-sensitive areas, possibly due to precipitation
37
a negative correlation of 39.44%, while Shache County that optimized soil moisture. In Tumushuke City,
37
correlated of 30.30%. High temperatures can exacerbate the proportion of negative correlations was 19.52%,
water evaporation and hinder vegetation growth, and the proportion of non-significant correlations was
particularly during drought years. The proportion of 64.75%, possibly due to excessive precipitation causing
38
non-significant correlations in Tumushuke City was soil erosion or vegetation adapting to drought, with
50.24%, while Bachu County and Makit County showed precipitation changes disrupting ecological balance.
A B
Figure 8. Interannual variation of climatic factors by land use types in the Yarkand River Basin. (A) Interannual
fluctuation of temperature factors under different land use types. (B) Interannual fluctuation in precipitation
factors for different land use types.
A B C
Figure 9. Correlation analysis between fractional vegetation cover changes and annual average temperature
in the Yarkand River Basin from 2000 to 2023. (A) Correlation between fractional vegetation cover and
annual average temperature. (B) p‑value. (C) Significant change area.
Volume 22 Issue 6 (2025) 233 doi: 10.36922/AJWEP025350269