
Page 72 - AJWEP-22-6
P. 72
Chen, et al.
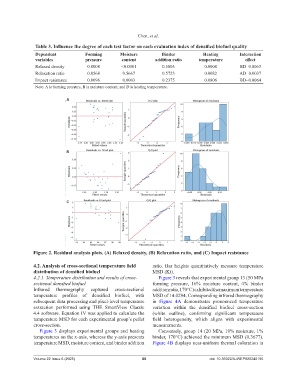
Table 3. Influence the degree of each test factor on each evaluation index of densified biofuel quality
Dependent Forming Moisture Binder Heating Interaction
variables pressure content addition ratio temperature effect
Relaxed density 0.0008 <0.0001 0.5005 0.0008 BD−0.0063
Relaxation ratio 0.0568 0.5667 0.5723 0.0082 AD−0.0037
Impact resistance 0.0096 0.0003 0.2375 0.0806 BD−0.0064
Note: A is forming pressure, B is moisture content, and D is heating temperature.
A
B
C
Figure 2. Residual analysis plots. (A) Relaxed density, (B) Relaxation ratio, and (C) Impact resistance
4.2. Analysis of cross-sectional temperature field ratio. Bar heights quantitatively measure temperature
distribution of densified biofuel MSD (Kt).
4.2.1. Temperature distribution and results of cross- Figure 3 reveals that experimental group 13 (50 MPa
sectional densified biofuel forming pressure, 16% moisture content, 4% binder
Infrared thermography captured cross-sectional addition ratio, 170°C) exhibited the maximum temperature
temperature profiles of densified biofuel, with MSD of 14.0294. Corresponding infrared thermography
subsequent data processing and pixel-level temperature in Figure 4A demonstrates pronounced temperature
extraction performed using THE SmartView Classic variation within the densified biofuel cross-section
4.4 software. Equation IV was applied to calculate the (white outline), confirming significant temperature
temperature MSD for each experimental group’s pellet field heterogeneity, which aligns with experimental
cross-section. measurements.
Figure 3 displays experimental groups and heating Conversely, group 14 (20 MPa, 10% moisture, 1%
temperatures on the x-axis, whereas the y-axis presents binder, 170°C) achieved the minimum MSD (0.3677).
temperature MSD, moisture content, and binder addition Figure 4B displays near-uniform thermal coloration in
Volume 22 Issue 6 (2025) 66 doi: 10.36922/AJWEP025240195