Page 71 - AJWEP-22-6
P. 71

Pine sawdust biofuel: Quality and temperature optimization

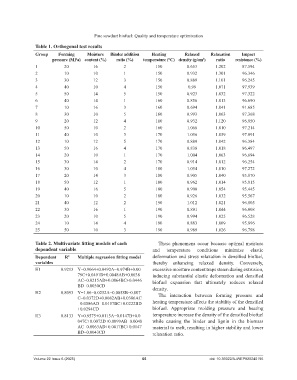
                 Table 1. Orthogonal test results
                 Group     Forming     Moisture   Binder addition   Heating       Relaxed     Relaxation   Impact
                        pressure (MPa) content (%)  ratio (%)   temperature (°C) density (g/cm )  ratio  resistance (%)
                                                                                          3
                 1           20           16           2             150           0.653        1.202       87.594
                 2           10           10           1             150           0.932        1.301       96.346
                 3           30           12           3             150           0.889        1.101       96.245
                 4           40           10           4             150            0.99        1.071       97.939
                 5           50           14           5             150           0.923        1.032       97.322
                 6           40           14           1             160           0.856        1.013       96.690
                 7           10           16           3             160           0.694        1.041       91.685
                 8           30           10           5             160           0.993        1.063       97.368
                 9           20           12           4             160           0.932        1.120       96.850
                 10          50           10           2             160           1.066        1.010       97.214
                 11          40           10           3             170           1.056        1.059       97.891
                 12          10           12           5             170           0.889        1.042       96.384
                 13          50           16           4             170           0.838        1.018       96.497
                 14          20           10           1             170           1.004        1.063       96.694
                 15          30           14           2             170           0.914        1.012       96.254
                 16          30           10           4             180           1.054        1.010       97.272
                 17          20           14           3             180           0.905        1.040       95.870
                 18          50           12           1             180           0.962        1.014       95.815
                 19          40           16           5             180           0.900        1.054       95.445
                 20          10           10           2             180           0.926        1.032       95.567
                 21          40           12           2             190           1.012        1.021       96.805
                 22          30           16           1             190           0.891        1.044       96.008
                 23          20           10           5             190           0.994        1.025       96.528
                 24          10           14           4             190           0.883        1.009       95.896
                 25          50           10           3             190           0.989        1.026       96.798


                 Table 2. Multivariate fitting models of each          These phenomena occur because optimal moisture
                 dependent variable                                 and   temperature   conditions  minimize   elastic

                 Dependent    R 2  Multiple regression fitting model  deformation and stress relaxation in densified biofuel,
                 variables                                          thereby  enhancing  relaxed  density. Conversely,
                 H1         0.9213 Y=0.9064+0.0492A−0.974B+0.00     excessive moisture content traps steam during extrusion,
                                   79C+0.0491D+0.0048AB+0.0038      inducing substantial elastic deformation and densified
                                   AC−0.0215AD+0.0064BC+0.0446      biofuel  expansion  that  ultimately  reduces  relaxed
                                   BD−0.0030CD                      density.
                 H2         0.8093 Y=1.06−0.0252A−0.0058B−0.007        The interaction between  forming  pressure and
                                   C−0.0372D+0.0082AB+0.0386AC
                                   −0.0586AD−0.0157BC+0.0222BD      heating temperature affects the stability of the densified
                                   +0.0294CD                        biofuel.  Appropriate  molding  pressure and heating
                 H3         0.8133 Y=0.9575+0.0115A−0.0147B+0.0     temperature increase the density of the densified biofuel
                                   047C+0.0072D+0.0099AB−0.0048     while causing the binder and lignin  in the biomass
                                   AC−0.0063AD+0.0017BC+0.0147      material to melt, resulting in higher stability and lower
                                   BD−0.0043CD                      relaxation ratio.


                Volume 22 Issue 6 (2025)                        65                           doi: 10.36922/AJWEP025240195
   66   67   68   69   70   71   72   73   74   75   76