
Page 70 - AJWEP-22-6
P. 70
Chen, et al.
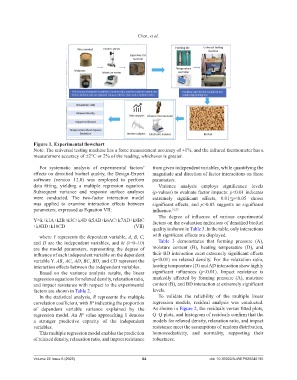
Figure 1. Experimental flowchart
Note: The universal testing machine has a force measurement accuracy of ±1%, and the infrared thermometer has a
measurement accuracy of ±2°C or 2% of the reading, whichever is greater.
For systematic analysis of experimental factors’ from given independent variables, while quantifying the
effects on densified biofuel quality, the Design-Expert magnitude and direction of factor interactions on these
software (version 12.0) was employed to perform parameters.
data fitting, yielding a multiple regression equation. Variance analysis employs significance levels
Subsequent variance and response surface analyses (p-values) to evaluate factor impacts: p<0.01 indicates
were conducted. The two-factor interaction model extremely significant effects, 0.01≤p<0.05 shows
was applied to examine interaction effects between significant effects, and p>0.05 suggests no significant
parameters, expressed as Equation VII: influence. 31,33
The degree of influence of various experimental
Y= k+k1A+k2B+k3C+k4D+k5AB+k6AC+k7AD+k8BC factors on the evaluation indicators of densified biofuel
+k9BD+k10CD (VII) quality is shown in Table 3. In the table, only interactions
where Y represents the dependent variable, A, B, C, with significant effects are displayed.
and D are the independent variables, and ki (i=0~10) Table 3 demonstrates that forming pressure (A),
are the model parameters, representing the degree of moisture content (B), heating temperature (D), and
influence of each independent variable on the dependent their BD interaction exert extremely significant effects
variable Y. AB, AC, AD, BC, BD, and CD represent the (p<0.01) on relaxed density. For the relaxation ratio,
interaction effects between the independent variables. heating temperature (D) and AD interaction show highly
Based on the variance analysis results, the linear significant influences (p<0.01). Impact resistance is
regression equations for relaxed density, relaxation ratio, markedly affected by forming pressure (A), moisture
and impact resistance with respect to the experimental content (B), and BD interaction at extremely significant
factors are shown in Table 2. levels.
In the statistical analysis, R represents the multiple To validate the reliability of the multiple linear
correlation coefficient, with R indicating the proportion regression models, residual analysis was conducted.
2
of dependent variable variance explained by the As shown in Figure 2, the residuals versus fitted plots,
regression model. An R value approaching 1 denotes Q–Q plots, and histogram of residuals confirm that the
2
a stronger predictive capacity of the independent models for relaxed density, relaxation ratio, and impact
variables. resistance meet the assumptions of random distribution,
This multiple regression model enables the prediction homoscedasticity, and normality, supporting their
of relaxed density, relaxation ratio, and impact resistance robustness.
Volume 22 Issue 6 (2025) 64 doi: 10.36922/AJWEP025240195