
Page 74 - AJWEP-22-6
P. 74
Chen, et al.
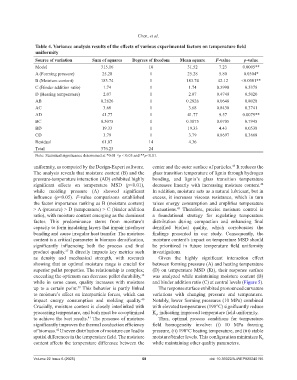
Table 4. Variance analysis results of the effects of various experimental factors on temperature field
uniformity
Source of variation Sum of squares Degrees of freedom Mean square F-value p-value
Model 315.16 10 31.52 7.23 0.0005**
A (Forming pressure) 25.28 1 25.28 5.80 0.0304*
B (Moisture content) 183.74 1 183.74 42.12 <0.0001**
C (Binder addition ratio) 1.74 1 1.74 0.3990 0.5378
D (Heating temperature) 2.07 1 2.07 0.4749 0.5020
AB 0.2826 1 0.2826 0.0648 0.8028
AC 3.68 1 3.68 0.8430 0.3741
AD 41.77 1 41.77 9.57 0.0079**
BC 0.3075 1 0.3075 0.0705 0.7945
BD 19.33 1 19.33 4.43 0.0538
CD 3.79 1 3.79 0.8697 0.3668
Residual 61.07 14 4.36
Total 376.23 24
Note: Statistical significance determined at *0.01 ≤p < 0.05 and **p<0.01.
uniformity, as computed by the Design-Expert software. center and the outer surface of particles. It reduces the
43
The analysis reveals that moisture content (B) and the glass transition temperature of lignin through hydrogen
pressure-temperature interaction (AD) exhibited highly bonding, and lignin’s glass transition temperature
significant effects on temperature MSD (p<0.01), decreases linearly with increasing moisture content.
44
while molding pressure (A) showed significant In addition, moisture acts as a natural lubricant, but in
influence (p<0.05). F-value comparisons established excess, it increases viscous resistance, which in turn
the factor importance ranking as B (moisture content) raises energy consumption and amplifies temperature
> A (pressure) > D (temperature) > C (binder addition fluctuations. Therefore, precise moisture control is
45
ratio), with moisture content emerging as the dominant a foundational strategy for regulating temperature
factor. This predominance stems from moisture’s distribution during compaction and enhancing final
capacity to form insulating layers that impair interlayer densified biofuel quality, which corroborates the
bonding and cause irregular heat transfer. The moisture findings presented in our study. Consequently, the
content is a critical parameter in biomass densification, moisture content’s impact on temperature MSD should
significantly influencing both the process and final be prioritized in future temperature field uniformity
product quality. It directly impacts key metrics such investigations.
37
as density and mechanical strength, with research Given the highly significant interaction effect
showing that an optimal moisture range is crucial for between forming pressure (A) and heating temperature
superior pellet properties. The relationship is complex; (D) on temperature MSD (Kt), their response surface
exceeding the optimum can decrease pellet durability, was analyzed while maintaining moisture content (B)
38
while in some cases, quality increases with moisture and binder addition ratio (C) at central levels (Figure 5).
up to a certain point. This behavior is partly linked The response surface exhibited pronounced curvature
39
to moisture’s effect on interparticle forces, which can variations with changing pressure and temperature.
impact energy consumption and molding quality. Notably, lower forming pressures (10 MPa) combined
40
Crucially, moisture content is closely interlinked with with elevated temperatures (190°C) significantly reduce
processing temperature, and both must be co-optimized K , indicating improved temperature field uniformity.
t
to achieve the best results. The presence of moisture Thus, optimal process conditions for temperature
41
significantly improves the thermal conduction efficiency field homogeneity involve: (i) 10 MPa forming
of biomass. Uneven distribution of moisture can lead to pressure, (ii) 190°C heating temperature, and (iii) stable
42
spatial differences in the temperature field. The moisture moisture/binder levels. This configuration minimizes K
t
content affects the temperature difference between the while maintaining other quality parameters.
Volume 22 Issue 6 (2025) 68 doi: 10.36922/AJWEP025240195