
Page 73 - AJWEP-22-6
P. 73
Pine sawdust biofuel: Quality and temperature optimization
the cross-section, indicating homogeneous temperature Other researchers have employed different
distribution. approaches to evaluate temperature field uniformity
Comparative analysis revealed that non-uniform in their studies. Vanherck et al. used the difference
34
temperature distributions correlated with surface between maximum and minimum temperatures as
cracking and rough cross-sections with material an indicator of temperature uniformity. Bai et al.
35
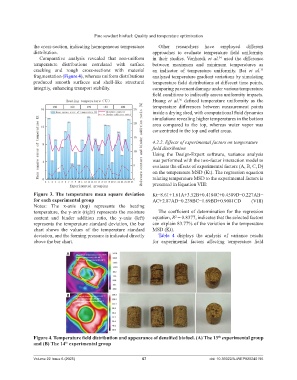
fragmentation (Figure 4), whereas uniform distributions analyzed temperature gradient variations by simulating
produced smooth surfaces and shell-like structural temperature field distributions at different time points,
integrity, enhancing transport stability. comparing pavement damage under various temperature
field conditions to indirectly assess uniformity impacts.
Huang et al. defined temperature uniformity as the
36
temperature differences between measurement points
inside a drying shed, with computational fluid dynamics
simulations revealing higher temperatures in the bottom
area compared to the top, whereas water vapor was
concentrated in the top and outlet areas.
4.2.2. Effects of experimental factors on temperature
field distribution
Using the Design-Expert software, variance analysis
was performed with the two-factor interaction model to
evaluate the effects of experimental factors (A, B, C, D)
on the temperature MSD (Kt). The regression equation
relating temperature MSD to the experimental factors is
presented in Equation VIII:
Figure 3. The temperature mean square deviation Kt=8.61+1.61A+3.52B+0.4184C+0.4589D−0.227AB−
for each experimental group AC+2.87AD−0.239BC−1.69BD+0.9081CD (VIII)
Notes: The x-axis (top) represents the heating
temperature, the y-axis (right) represents the moisture The coefficient of determination for the regression
content and binder addition ratio, the y-axis (left) equation, R = 0.8377, indicates that the selected factors
2
represents the temperature standard deviation, the bar can explain 83.77% of the variation in the temperature
chart shows the values of the temperature standard MSD (Kt).
deviation, and the forming pressure is indicated directly Table 4 displays the analysis of variance results
above the bar chart. for experimental factors affecting temperature field
A
B
Figure 4. Temperature field distribution and appearance of densified biofuel. (A) The 13 experimental group
th
and (B) The 14 experimental group
th
Volume 22 Issue 6 (2025) 67 doi: 10.36922/AJWEP025240195